|
1600
|
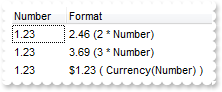
How do I set a computated cell individually
Dim h as N
Dim oG2antt as P
Dim var_Items as P

oG2antt = topparent:CONTROL_ACTIVEX1.activex
oG2antt.BeginUpdate()
oG2antt.Columns.Add("Number")
oG2antt.Columns.Add("Format")
var_Items = oG2antt.Items
	h = var_Items.AddItem("1.23")
	' var_Items.CellValueFormat(h,1) = 2
	oG2antt.TemplateDef = "dim var_Items,h"
	oG2antt.TemplateDef = var_Items
	oG2antt.TemplateDef = h
	oG2antt.Template = "var_Items.CellValueFormat(h,1) = 2"

	' var_Items.CellValue(h,1) = "2 * %0 + ` (2 * Number)`"
	oG2antt.TemplateDef = "dim var_Items,h"
	oG2antt.TemplateDef = var_Items
	oG2antt.TemplateDef = h
	oG2antt.Template = "var_Items.CellValue(h,1) = `2 * %0 + `` (2 * Number)```"

	h = var_Items.AddItem("1.23")
	' var_Items.CellValueFormat(h,1) = 2
	oG2antt.TemplateDef = "dim var_Items,h"
	oG2antt.TemplateDef = var_Items
	oG2antt.TemplateDef = h
	oG2antt.Template = "var_Items.CellValueFormat(h,1) = 2"

	' var_Items.CellValue(h,1) = "3 * %0 + ` (3 * Number)`"
	oG2antt.TemplateDef = "dim var_Items,h"
	oG2antt.TemplateDef = var_Items
	oG2antt.TemplateDef = h
	oG2antt.Template = "var_Items.CellValue(h,1) = `3 * %0 + `` (3 * Number)```"

	h = var_Items.AddItem("1.23")
	' var_Items.CellValueFormat(h,1) = 2
	oG2antt.TemplateDef = "dim var_Items,h"
	oG2antt.TemplateDef = var_Items
	oG2antt.TemplateDef = h
	oG2antt.Template = "var_Items.CellValueFormat(h,1) = 2"

	' var_Items.CellValue(h,1) = "currency(%0) + ` ( Currency(Number) )`"
	oG2antt.TemplateDef = "dim var_Items,h"
	oG2antt.TemplateDef = var_Items
	oG2antt.TemplateDef = h
	oG2antt.Template = "var_Items.CellValue(h,1) = `currency(%0) + `` ( Currency(Number) )```"

oG2antt.EndUpdate()
|
|
1599
|
How can I hide a specific hour
Dim oG2antt as P
Dim var_Chart as P
Dim var_InsideZooms as P
Dim var_InsideZooms1 as P
Dim var_Items as P
Dim var_Level as local

oG2antt = topparent:CONTROL_ACTIVEX1.activex
oG2antt.BeginUpdate()
oG2antt.DrawGridLines = -1
oG2antt.Columns.Add("Default")
var_Chart = oG2antt.Chart
	var_Chart.AllowInsideZoom = .t.
	var_Chart.FirstWeekDay = 1
	var_Chart.FirstVisibleDate = {03/31/2013}
	' var_Chart.PaneWidth(.f.) = 52
	oG2antt.TemplateDef = "dim var_Chart"
	oG2antt.TemplateDef = var_Chart
	oG2antt.Template = "var_Chart.PaneWidth(False) = 52"

	var_Chart.LevelCount = 2
	var_Chart.UnitScale = 65536
	' var_Chart.Level(1).Label = "<font ;6><%h%></font>"
	var_Level = var_Chart.Level(1)
	oG2antt.TemplateDef = "dim var_Level"
	oG2antt.TemplateDef = var_Level
	oG2antt.Template = "var_Level.Label = `<font ;6><%h%></font>`"

	var_Chart.UnitWidth = 14
	var_Chart.DrawGridLines = -1
	var_Chart.AllowInsideZoom = .t.
	var_Chart.DefaultInsideZoomFormat.InsideUnit = 1048576
	var_Chart.AllowResizeInsideZoom = .f.
	var_Chart.InsideZoomOnDblClick = .f.
	var_InsideZooms = var_Chart.InsideZooms
		var_InsideZooms.SplitBaseLevel = .f.
		var_InsideZooms.DefaultWidth = 0
	var_InsideZooms1 = var_Chart.InsideZooms
		var_InsideZooms1.Add({03/31/2013 23:00:00})
var_Items = oG2antt.Items
	var_Items.AddItem("Item")
oG2antt.EndUpdate()
|
|
1598
|
Is it possible to define the keys of the drop down values to be strings rather than numeric values
' Occurs when the user changes the cell's content.
function Change as v (Item  as  OLE::Exontrol.G2antt.1::HITEM, ColIndex  as  N, NewValue  as  A)
	oG2antt = topparent:CONTROL_ACTIVEX1.activex
	? "NewValue is"
	? NewValue
end function

Dim oG2antt as P
Dim var_Editor as P
Dim var_Editor1 as P
Dim var_Items as P

oG2antt = topparent:CONTROL_ACTIVEX1.activex
var_Editor = oG2antt.Columns.Add("DropDownList-String").Editor
	var_Editor.EditType = 3
	var_Editor.AddItem(1,"NYC|New York City")
	var_Editor.AddItem(2,"CJN|Cluj Napoca")
var_Editor1 = oG2antt.Columns.Add("DropDownList-Numeric").Editor
	var_Editor1.EditType = 3
	var_Editor1.AddItem(1,"New York City")
	var_Editor1.AddItem(2,"Cluj Napoca")
var_Items = oG2antt.Items
	' var_Items.CellValue(var_Items.AddItem("NYC"),1) = 2
	oG2antt.TemplateDef = "dim var_Items"
	oG2antt.TemplateDef = var_Items
	oG2antt.Template = "var_Items.CellValue(AddItem(`NYC`),1) = 2"
|
|
1597
|
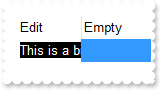
I have an edit field, when going to edit mode, the rightmost part is shown. Is it possible to show the left part instead
Dim oG2antt as P
Dim var_Column as P
Dim var_Editor as P
Dim var_Items as P

oG2antt = topparent:CONTROL_ACTIVEX1.activex
oG2antt.BeginUpdate()
var_Column = oG2antt.Columns.Add("Edit")
	var_Column.Width = 64
	var_Column.AllowSizing = .f.
	var_Editor = var_Column.Editor
		var_Editor.EditType = 8
		var_Editor.Mask = ";;;rich"
oG2antt.Columns.Add("Empty")
var_Items = oG2antt.Items
	var_Items.AddItem("This is a bit ot long text")
	var_Items.AddItem("")
oG2antt.EndUpdate()
|
|
1596
|
I have a drop down field, the control shows the rightmost part of the selected caption. Is it possible to show the left part
Dim h as N
Dim oG2antt as P
Dim var_Column as P
Dim var_Column1 as P
Dim var_Editor as P
Dim var_Editor1 as P
Dim var_Editor2 as P
Dim var_Editor3 as P
Dim var_Items as P

oG2antt = topparent:CONTROL_ACTIVEX1.activex
oG2antt.BeginUpdate()
var_Column = oG2antt.Columns.Add("DropDown")
	var_Column.Width = 64
	var_Column.AllowSizing = .f.
	var_Editor = var_Column.Editor
		var_Editor.DropDownAlignment = 32 '20 +
		var_Editor.EditType = 2
		var_Editor.AddItem(1,"First item. This is a bit ot long text")
		var_Editor.AddItem(2,"Second item. This is a bit ot long text")
		var_Editor.AddItem(3,"Third item. This is a bit ot long text")
		var_Editor.Mask = ";;;rich"
var_Column1 = oG2antt.Columns.Add("PickEdit")
	var_Column1.Width = 64
	var_Column1.AllowSizing = .f.
	var_Editor1 = var_Column1.Editor
		var_Editor1.DropDownAlignment = 32 '20 +
		var_Editor1.EditType = 14
		var_Editor1.AddItem(1,"First item. This is a bit ot long text")
		var_Editor1.AddItem(2,"Second item. This is a bit ot long text")
		var_Editor1.AddItem(3,"Third item. This is a bit ot long text")
		var_Editor1.Mask = ";;;rich"
oG2antt.Columns.Add("Empty")
var_Items = oG2antt.Items
	' var_Items.CellValue(var_Items.AddItem("First item. This is a bit ot long text"),1) = "Second item. This is a bit ot long text"
	oG2antt.TemplateDef = "dim var_Items"
	oG2antt.TemplateDef = var_Items
	oG2antt.Template = "var_Items.CellValue(AddItem(`First item. This is a bit ot long text`),1) = `Second item. This is a bit ot long text`"

	h = var_Items.AddItem("First item. This is a bit ot long text")
	var_Editor2 = var_Items.CellEditor(h,0)
		var_Editor2.DropDownAlignment = 32 '20 +
		var_Editor2.EditType = 2
		var_Editor2.AddItem(1,"First item. This is a bit ot long text")
		var_Editor2.AddItem(2,"Second item. This is a bit ot long text")
		var_Editor2.AddItem(3,"Third item. This is a bit ot long text")
	' var_Items.CellValue(h,1) = "Second item. This is a bit ot long text"
	oG2antt.TemplateDef = "dim var_Items,h"
	oG2antt.TemplateDef = var_Items
	oG2antt.TemplateDef = h
	oG2antt.Template = "var_Items.CellValue(h,1) = `Second item. This is a bit ot long text`"

	var_Editor3 = var_Items.CellEditor(h,1)
		var_Editor3.DropDownAlignment = 32 '20 +
		var_Editor3.EditType = 14
		var_Editor3.AddItem(1,"First item. This is a bit ot long text")
		var_Editor3.AddItem(2,"Second item. This is a bit ot long text")
		var_Editor3.AddItem(3,"Third item. This is a bit ot long text")
oG2antt.EndUpdate()
|
|
1595
|
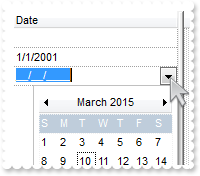
Is there a property for the back color of the dropdown field
Dim oG2antt as P
Dim var_Editor as P

oG2antt = topparent:CONTROL_ACTIVEX1.activex
oG2antt.BeginUpdate()
var_Editor = oG2antt.Columns.Add("Date").Editor
	var_Editor.EditType = 7
	' var_Editor.Option(55) = 15790320
	oG2antt.TemplateDef = "dim var_Editor"
	oG2antt.TemplateDef = var_Editor
	oG2antt.Template = "var_Editor.Option(55) = 15790320"

	' var_Editor.Option(56) = 65793
	oG2antt.TemplateDef = "dim var_Editor"
	oG2antt.TemplateDef = var_Editor
	oG2antt.Template = "var_Editor.Option(56) = 65793"

oG2antt.Items.AddItem({01/01/2001})
oG2antt.EndUpdate()
|
|
1594
|
Is it possible to change a back color of the field/cell when it takes a focus
' Occurs when the edit operation ends.
function EditClose as v ()
	Dim var_Items as P
	oG2antt = topparent:CONTROL_ACTIVEX1.activex
	var_Items = oG2antt.Items
		var_Items.ClearCellBackColor(var_Items.FocusItem,oG2antt.FocusColumnIndex)
end function

' Occurs when the edit operation starts.
function EditOpen as v ()
	Dim var_Items as P
	Dim var_Items1 as P
	oG2antt = topparent:CONTROL_ACTIVEX1.activex
	var_Items = oG2antt.Items
		' var_Items.CellBackColor(var_Items.FocusItem,oG2antt.FocusColumnIndex) = 255
		oG2antt.TemplateDef = "dim var_Items"
		oG2antt.TemplateDef = var_Items
		oG2antt.Template = "var_Items.CellBackColor(FocusItem,Me.FocusColumnIndex) = 255"
	var_Items1 = oG2antt.Items
		' var_Items1.CellValue(var_Items1.FocusItem,oG2antt.FocusColumnIndex) = oG2antt.Items.CellValue(oG2antt.Items.FocusItem,oG2antt.FocusColumnIndex)
		oG2antt.TemplateDef = "dim var_Items1"
		oG2antt.TemplateDef = var_Items1
		oG2antt.Template = "var_Items1.CellValue(FocusItem,Me.FocusColumnIndex) = Me.Items.CellValue(Me.Items.FocusItem,Me.FocusColumnIndex)"

end function

Dim oG2antt as P
Dim var_Editor as local
Dim var_Editor1 as local
Dim var_Items as P

oG2antt = topparent:CONTROL_ACTIVEX1.activex
oG2antt.FullRowSelect = 0
' oG2antt.Columns.Add("C1").Editor.EditType = 1
var_Editor = oG2antt.Columns.Add("C1").Editor
oG2antt.TemplateDef = "dim var_Editor"
oG2antt.TemplateDef = var_Editor
oG2antt.Template = "var_Editor.EditType = 1"

' oG2antt.Columns.Add("C2").Editor.EditType = 1
var_Editor1 = oG2antt.Columns.Add("C2").Editor
oG2antt.TemplateDef = "dim var_Editor1"
oG2antt.TemplateDef = var_Editor1
oG2antt.Template = "var_Editor1.EditType = 1"

var_Items = oG2antt.Items
	' var_Items.CellValue(var_Items.AddItem("v1"),1) = "v2"
	oG2antt.TemplateDef = "dim var_Items"
	oG2antt.TemplateDef = var_Items
	oG2antt.Template = "var_Items.CellValue(AddItem(`v1`),1) = `v2`"

	' var_Items.CellValue(var_Items.AddItem("v3"),1) = "v4"
	oG2antt.TemplateDef = "dim var_Items"
	oG2antt.TemplateDef = var_Items
	oG2antt.Template = "var_Items.CellValue(AddItem(`v3`),1) = `v4`"
|
|
1593
|
How can I display the current date mask, but still allow empty values
Dim oG2antt as P
Dim var_Editor as P
Dim var_Items as P

oG2antt = topparent:CONTROL_ACTIVEX1.activex
oG2antt.BeginUpdate()
oG2antt.CauseValidateValue = .t.
oG2antt.FullRowSelect = 0
oG2antt.DrawGridLines = -2
var_Editor = oG2antt.Columns.Add("Date").Editor
	var_Editor.EditType = 7
	var_Editor.Mask = "!99/99/9999;1;;empty=1,validateas=1,invalid=Invalid date\, for the input mask <br><b>'<%mask%>'</b>!,warning=Invalid character!,select=4,overtype"
var_Items = oG2antt.Items
	var_Items.AddItem()
	var_Items.AddItem({01/01/2001})
	var_Items.AddItem()
oG2antt.EndUpdate()
|
|
1592
|
How can I align the days in a DateType editor
Dim oG2antt as P
Dim var_Editor as P
Dim var_Editor1 as P
Dim var_Editor2 as P
Dim var_Editor3 as P
Dim var_Editor4 as P
Dim var_Editor5 as P
Dim var_Items as P

oG2antt = topparent:CONTROL_ACTIVEX1.activex
oG2antt.Columns.Add("DropDown")
var_Items = oG2antt.Items
	var_Editor = var_Items.CellEditor(var_Items.AddItem({01/01/2001}),0)
		var_Editor.EditType = 7
		var_Editor.DropDownAlignment = 2
	var_Editor1 = var_Items.CellEditor(var_Items.AddItem({01/01/2001}),0)
		var_Editor1.EditType = 7
		var_Editor1.DropDownAlignment = 1
	var_Editor2 = var_Items.CellEditor(var_Items.AddItem({01/01/2001}),0)
		var_Editor2.EditType = 7
		var_Editor2.DropDownAlignment = 0
	var_Editor3 = var_Items.CellEditor(var_Items.AddItem({01/01/2001}),0)
		var_Editor3.EditType = 7
		var_Editor3.DropDownAlignment = 32 '20 +
	var_Editor4 = var_Items.CellEditor(var_Items.AddItem({01/01/2001}),0)
		var_Editor4.EditType = 7
		var_Editor4.DropDownAlignment = 33 '20 + CenterAlignment
	var_Editor5 = var_Items.CellEditor(var_Items.AddItem({01/01/2001}),0)
		var_Editor5.EditType = 7
		var_Editor5.DropDownAlignment = 34 '20 + RightAlignment
|
|
1591
|
How can I align the drop down portion rather the inside captions
Dim oG2antt as P
Dim var_Editor as local
Dim var_Editor1 as P
Dim var_Editor2 as P
Dim var_Items as P

oG2antt = topparent:CONTROL_ACTIVEX1.activex
' oG2antt.Columns.Add("DropDown").Editor.EditType = 7
var_Editor = oG2antt.Columns.Add("DropDown").Editor
oG2antt.TemplateDef = "dim var_Editor"
oG2antt.TemplateDef = var_Editor
oG2antt.Template = "var_Editor.EditType = 7"

var_Items = oG2antt.Items
	var_Editor1 = var_Items.CellEditor(var_Items.AddItem({01/01/2001}),0)
		var_Editor1.EditType = 7
		var_Editor1.DropDownAlignment = 32 '20 +
	var_Editor2 = var_Items.CellEditor(var_Items.AddItem({01/01/2001}),0)
		var_Editor2.EditType = 7
		var_Editor2.DropDownAlignment = 16
	var_Items.AddItem({01/01/2001})
|
|
1590
|
Is it possible to show a message that the field is empty

Dim oG2antt as P
Dim var_Column as P
Dim var_Editor as P

oG2antt = topparent:CONTROL_ACTIVEX1.activex
oG2antt.DrawGridLines = -2
oG2antt.FullRowSelect = 0
var_Column = oG2antt.Columns.Add("Float")
	var_Editor = var_Column.Editor
		var_Editor.EditType = 8
		var_Editor.Mask = ";;;float,digits=0,grouping=,invalid=empty,warning=invalid character"
oG2antt.Items.AddItem(192278)
oG2antt.Items.AddItem(1000)
|
|
1589
|
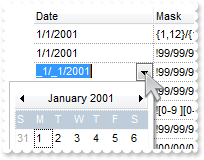
How can I mask a date
Dim h as N
Dim oG2antt as P
Dim var_Editor as P
Dim var_Editor1 as P
Dim var_Editor2 as P
Dim var_Editor3 as P
Dim var_Editor4 as P
Dim var_Editor5 as P
Dim var_Editor6 as P
Dim var_Editor7 as P
Dim var_Editor8 as P
Dim var_Items as P

oG2antt = topparent:CONTROL_ACTIVEX1.activex
oG2antt.BeginUpdate()
oG2antt.CauseValidateValue = .t.
oG2antt.FullRowSelect = 0
oG2antt.DrawGridLines = -2
oG2antt.Columns.Add("Date")
oG2antt.Columns.Add("Mask")
var_Items = oG2antt.Items
	h = var_Items.AddItem({01/01/2001})
	var_Editor = var_Items.CellEditor(h,0)
		var_Editor.EditType = 7
		var_Editor.Mask = "{1,12}/{1,31}/{1950,2050};1;;select=1,warning=Invalid character!,invalid=Invalid date\, for the input mask <br><b>'<%mask%>'</b>!,validateas=1"
	' var_Items.CellValue(h,1) = var_Items.CellEditor(h,0).Mask
	oG2antt.TemplateDef = "dim var_Items,h"
	oG2antt.TemplateDef = var_Items
	oG2antt.TemplateDef = h
	oG2antt.Template = "var_Items.CellValue(h,1) = CellEditor(h,0).Mask"

	h = var_Items.AddItem({01/01/2001})
	var_Editor1 = var_Items.CellEditor(h,0)
		var_Editor1.EditType = 7
		var_Editor1.Mask = "!99/99/9999;1;;empty,validateas=1,invalid=Invalid date\, for the input mask <br><b>'<%mask%>'</b>!,warning=Invalid character!,select=4,overtype"
	' var_Items.CellValue(h,1) = var_Items.CellEditor(h,0).Mask
	oG2antt.TemplateDef = "dim var_Items,h"
	oG2antt.TemplateDef = var_Items
	oG2antt.TemplateDef = h
	oG2antt.Template = "var_Items.CellValue(h,1) = CellEditor(h,0).Mask"

	h = var_Items.AddItem({01/01/2001})
	var_Editor2 = var_Items.CellEditor(h,0)
		var_Editor2.EditType = 7
		var_Editor2.Mask = "!99/99/9999;;;empty,validateas=1,invalid=Invalid date\, for the input mask <br><b>'<%mask%>'</b>!,warning=Invalid character!,select=4,overtype"
	' var_Items.CellValue(h,1) = var_Items.CellEditor(h,0).Mask
	oG2antt.TemplateDef = "dim var_Items,h"
	oG2antt.TemplateDef = var_Items
	oG2antt.TemplateDef = h
	oG2antt.Template = "var_Items.CellValue(h,1) = CellEditor(h,0).Mask"

	h = var_Items.AddItem({01/01/2001})
	var_Editor3 = var_Items.CellEditor(h,0)
		var_Editor3.EditType = 7
		var_Editor3.Mask = "!99/99/9999;; ;select=4,overtype,empty,warning=Invalid character!,invalid=Invalid date\, for the input mask <br><b>'<%mask%>'</b>!,validateas=1"
	' var_Items.CellValue(h,1) = var_Items.CellEditor(h,0).Mask
	oG2antt.TemplateDef = "dim var_Items,h"
	oG2antt.TemplateDef = var_Items
	oG2antt.TemplateDef = h
	oG2antt.Template = "var_Items.CellValue(h,1) = CellEditor(h,0).Mask"

	h = var_Items.AddItem({01/01/2001})
	var_Editor4 = var_Items.CellEditor(h,0)
		var_Editor4.EditType = 7
		var_Editor4.Mask = "![0-9 ][0-9 ]/[0-9 ][0-9 ]/[0-9 ][0-9 ][0-9 ][0-9 ];1;;empty,validateas=1,invalid=Invalid date\, for the input mask <br><b>'<%mask%>'</b>!,warning=Invalid character!,select=4,leading= "
	' var_Items.CellValue(h,1) = var_Items.CellEditor(h,0).Mask
	oG2antt.TemplateDef = "dim var_Items,h"
	oG2antt.TemplateDef = var_Items
	oG2antt.TemplateDef = h
	oG2antt.Template = "var_Items.CellValue(h,1) = CellEditor(h,0).Mask"

	h = var_Items.AddItem({01/01/2001})
	' var_Items.FormatCell(h,0) = "len(value) ? shortdateF(value) : ``"
	oG2antt.TemplateDef = "dim var_Items,h"
	oG2antt.TemplateDef = var_Items
	oG2antt.TemplateDef = h
	oG2antt.Template = "var_Items.FormatCell(h,0) = `len(value) ? shortdateF(value) : `````"

	var_Editor5 = var_Items.CellEditor(h,0)
		var_Editor5.EditType = 7
		var_Editor5.Mask = "!99/99/9999;1;;empty,validateas=1,invalid=Invalid date\, for the input mask <br><b>'<%mask%>'</b>!,warning=Invalid character!,select=4,overtype,leading"
	' var_Items.CellValue(h,1) = var_Items.CellEditor(h,0).Mask
	oG2antt.TemplateDef = "dim var_Items,h"
	oG2antt.TemplateDef = var_Items
	oG2antt.TemplateDef = h
	oG2antt.Template = "var_Items.CellValue(h,1) = CellEditor(h,0).Mask"

	h = var_Items.AddItem({01/01/2001})
	' var_Items.FormatCell(h,0) = "len(value) ? shortdateF(value) : ``"
	oG2antt.TemplateDef = "dim var_Items,h"
	oG2antt.TemplateDef = var_Items
	oG2antt.TemplateDef = h
	oG2antt.Template = "var_Items.FormatCell(h,0) = `len(value) ? shortdateF(value) : `````"

	var_Editor6 = var_Items.CellEditor(h,0)
		var_Editor6.EditType = 7
		var_Editor6.Mask = "!00/00/0000;1;;empty,validateas=1,invalid=Invalid date\, for the input mask <br><b>'<%mask%>'</b>!,warning=Invalid character!,select=4,overtype,leading"
	' var_Items.CellValue(h,1) = var_Items.CellEditor(h,0).Mask
	oG2antt.TemplateDef = "dim var_Items,h"
	oG2antt.TemplateDef = var_Items
	oG2antt.TemplateDef = h
	oG2antt.Template = "var_Items.CellValue(h,1) = CellEditor(h,0).Mask"

	h = var_Items.AddItem({01/01/2001})
	' var_Items.FormatCell(h,0) = "len(value) ? shortdateF(value) : ``"
	oG2antt.TemplateDef = "dim var_Items,h"
	oG2antt.TemplateDef = var_Items
	oG2antt.TemplateDef = h
	oG2antt.Template = "var_Items.FormatCell(h,0) = `len(value) ? shortdateF(value) : `````"

	var_Editor7 = var_Items.CellEditor(h,0)
		var_Editor7.EditType = 7
		var_Editor7.Mask = "!00/00/0000;;0;empty,validateas=1,invalid=Invalid date\, for the input mask <br><b>'<%mask%>'</b>!,warning=Invalid character!,select=4,overtype"
	' var_Items.CellValue(h,1) = var_Items.CellEditor(h,0).Mask
	oG2antt.TemplateDef = "dim var_Items,h"
	oG2antt.TemplateDef = var_Items
	oG2antt.TemplateDef = h
	oG2antt.Template = "var_Items.CellValue(h,1) = CellEditor(h,0).Mask"

	h = var_Items.AddItem({01/01/2001})
	' var_Items.FormatCell(h,0) = "len(value) ? shortdateF(value) : ``"
	oG2antt.TemplateDef = "dim var_Items,h"
	oG2antt.TemplateDef = var_Items
	oG2antt.TemplateDef = h
	oG2antt.Template = "var_Items.FormatCell(h,0) = `len(value) ? shortdateF(value) : `````"

	var_Editor8 = var_Items.CellEditor(h,0)
		var_Editor8.EditType = 7
		var_Editor8.Mask = "!00/00/0000;;;empty,validateas=1,invalid=Invalid date\, for the input mask <br><b>'<%mask%>'</b>!,warning=Invalid character!,select=1,overtype"
	' var_Items.CellValue(h,1) = var_Items.CellEditor(h,0).Mask
	oG2antt.TemplateDef = "dim var_Items,h"
	oG2antt.TemplateDef = var_Items
	oG2antt.TemplateDef = h
	oG2antt.Template = "var_Items.CellValue(h,1) = CellEditor(h,0).Mask"

oG2antt.EndUpdate()
|
|
1588
|
How can I display and edit an integer number to show grouping digits too ( no decimals)
Dim oG2antt as P
Dim var_Column as P
Dim var_Editor as P

oG2antt = topparent:CONTROL_ACTIVEX1.activex
var_Column = oG2antt.Columns.Add("Float")
	var_Column.FormatColumn = "value format `0`"
	var_Editor = var_Column.Editor
		var_Editor.EditType = 8
		var_Editor.Mask = ";;;float,digits=0"
oG2antt.Items.AddItem(192278)
|
|
1587
|
How can I display and edit a float number to show grouping digits too
Dim oG2antt as P
Dim var_Column as P
Dim var_Editor as P

oG2antt = topparent:CONTROL_ACTIVEX1.activex
var_Column = oG2antt.Columns.Add("Float")
	var_Column.FormatColumn = "value format ``"
	var_Editor = var_Column.Editor
		var_Editor.EditType = 8
		var_Editor.Mask = ";;;float"
oG2antt.Items.AddItem(192278)
|
|
1586
|
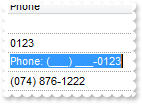
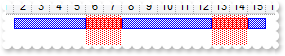
How can I mask a phone number
Dim h as N
Dim oG2antt as P
Dim var_Editor as local
Dim var_Editor1 as P
Dim var_Editor2 as P
Dim var_Editor3 as P
Dim var_Editor4 as P
Dim var_Items as P

oG2antt = topparent:CONTROL_ACTIVEX1.activex
oG2antt.CauseValidateValue = .t.
oG2antt.DrawGridLines = -2
oG2antt.FullRowSelect = 0
' oG2antt.Columns.Add("Phone").Editor.EditType = 8
var_Editor = oG2antt.Columns.Add("Phone").Editor
oG2antt.TemplateDef = "dim var_Editor"
oG2antt.TemplateDef = var_Editor
oG2antt.Template = "var_Editor.EditType = 8"

var_Items = oG2antt.Items
	h = var_Items.AddItem()
	var_Editor1 = var_Items.CellEditor(h,0)
		var_Editor1.EditType = 8
		var_Editor1.Mask = "!(999) 000 0000;1;;select=1,empty,overtype,warning=invalid characer,invalid=The value you entered isn't appropriate for the input mask <b>'<%mask%>'</b> specified for this field."
	h = var_Items.AddItem("0123")
	var_Editor2 = var_Items.CellEditor(h,0)
		var_Editor2.EditType = 8
		var_Editor2.Mask = "!(999) 000 0000;2;;select=4"
	h = var_Items.AddItem("0123")
	var_Editor3 = var_Items.CellEditor(h,0)
		var_Editor3.EditType = 8
		var_Editor3.Mask = "`Phone: `!(999) 000-0000"
	h = var_Items.AddItem("(074) 876-1222")
	var_Editor4 = var_Items.CellEditor(h,0)
		var_Editor4.EditType = 8
		var_Editor4.Mask = "!(999) 000-0000;0"
|
|
1585
|
Is it possible to display the ColorType fields using RGB format
Dim h as N
Dim oG2antt as P
Dim var_Editor as local
Dim var_Editor1 as P
Dim var_Editor2 as P
Dim var_Editor3 as P
Dim var_Editor4 as P
Dim var_Editor5 as P
Dim var_Editor6 as P
Dim var_Editor7 as P
Dim var_Items as P

oG2antt = topparent:CONTROL_ACTIVEX1.activex
' oG2antt.Columns.Add("Color").Editor.EditType = 9
var_Editor = oG2antt.Columns.Add("Color").Editor
oG2antt.TemplateDef = "dim var_Editor"
oG2antt.TemplateDef = var_Editor
oG2antt.Template = "var_Editor.EditType = 9"

var_Items = oG2antt.Items
	var_Items.AddItem(255)
	h = var_Items.AddItem(255)
	var_Editor1 = var_Items.CellEditor(h,0)
		var_Editor1.EditType = 9
		var_Editor1.Mask = "`RGB(`{0,255}\,{0,255}\,{0,255}`)`;;0"
	h = var_Items.AddItem(255)
	var_Editor2 = var_Items.CellEditor(h,0)
		var_Editor2.EditType = 9
		var_Editor2.Mask = "`&H`XXXXXXXX`&`;;0;overtype,insertype,warning=Wrong!"
	h = var_Items.AddItem(255)
	var_Editor3 = var_Items.CellEditor(h,0)
		var_Editor3.EditType = 9
		var_Editor3.Mask = "`0x`XX `0x`XX `0x`XX;;0;overtype,insertype,warning=Wrong!"
	h = var_Items.AddItem(255)
	var_Editor4 = var_Items.CellEditor(h,0)
		var_Editor4.EditType = 9
		var_Editor4.Mask = "R{0,255} G{0,255} B{0,255};;0;overtype,insertype,warning=Wrong!"
	h = var_Items.AddItem(255)
	var_Editor5 = var_Items.CellEditor(h,0)
		var_Editor5.EditType = 9
		var_Editor5.Mask = "`(hexa) RGB 0x`XXXXXX;;0;overtype,insertype,warning=Wrong!"
	h = var_Items.AddItem(255)
	var_Editor6 = var_Items.CellEditor(h,0)
		var_Editor6.EditType = 9
		var_Editor6.Mask = "`(decimal) Red: `{0,255}` Green: `{0,255}` Blue: `{0,255};;0;overtype,insertype,warning=Wrong!"
	h = var_Items.AddItem(255)
	var_Editor7 = var_Items.CellEditor(h,0)
		var_Editor7.EditType = 9
		var_Editor7.Mask = "`(combine) Red: `{0,255}` Green: 0x`XX` Blue: `{0,255};;0;overtype,insertype,warning=Wrong!"
|
|
1584
|
How can I specify a different color for bars that cross over the non-working part of the chart
Dim oG2antt as P
Dim var_Bar as local
Dim var_Bar1 as local
Dim var_Bars as P
Dim var_Chart as P
Dim var_Items as P

oG2antt = topparent:CONTROL_ACTIVEX1.activex
oG2antt.Columns.Add("Task")
var_Bars = oG2antt.Chart.Bars
	' var_Bars.Copy("Task","STask").Color = 255
	var_Bar = var_Bars.Copy("Task","STask")
	oG2antt.TemplateDef = "dim var_Bar"
	oG2antt.TemplateDef = var_Bar
	oG2antt.Template = "var_Bar.Color = 255"

	' var_Bars.Add("Task:STask").Shortcut = "TS"
	var_Bar1 = var_Bars.Add("Task:STask")
	oG2antt.TemplateDef = "dim var_Bar1"
	oG2antt.TemplateDef = var_Bar1
	oG2antt.Template = "var_Bar1.Shortcut = `TS`"

var_Chart = oG2antt.Chart
	' var_Chart.PaneWidth(.f.) = 96
	oG2antt.TemplateDef = "dim var_Chart"
	oG2antt.TemplateDef = var_Chart
	oG2antt.Template = "var_Chart.PaneWidth(False) = 96"

	var_Chart.FirstVisibleDate = {01/01/2001}
	var_Chart.NonworkingDaysColor = var_Chart.Bars.Item("STask").Color
var_Items = oG2antt.Items
	var_Items.AddBar(var_Items.AddItem("Task 1"),"TS",{01/02/2001},{01/16/2001})
|
|
1583
|
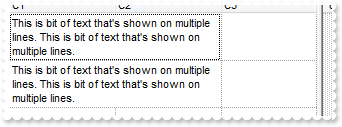
How can I merge two columns
' Occurs after a new Item has been inserted to Items collection.
function AddItem as v (Item  as  OLE::Exontrol.G2antt.1::HITEM)
	Dim var_Items as local
	oG2antt = topparent:CONTROL_ACTIVEX1.activex
	' oG2antt.Items.CellMerge(Item,0) = 1
	var_Items = oG2antt.Items
	oG2antt.TemplateDef = "dim var_Items"
	oG2antt.TemplateDef = var_Items
	oG2antt.Template = "var_Items.CellMerge(Item,0) = 1"

end function

Dim oG2antt as P
Dim var_Column as local
Dim var_Items as P

oG2antt = topparent:CONTROL_ACTIVEX1.activex
oG2antt.MarkSearchColumn = .f.
oG2antt.TreeColumnIndex = -1
oG2antt.DrawGridLines = -1
' oG2antt.Columns.Add("C1").Def(16) = .f.
var_Column = oG2antt.Columns.Add("C1")
oG2antt.TemplateDef = "dim var_Column"
oG2antt.TemplateDef = var_Column
oG2antt.Template = "var_Column.Def(16) = False"

oG2antt.Columns.Add("C2")
oG2antt.Columns.Add("C3")
var_Items = oG2antt.Items
	var_Items.AddItem("This is bit of text that's shown on multiple lines. This is bit of text that's shown on multiple lines.")
	var_Items.AddItem("This is bit of text that's shown on multiple lines. This is bit of text that's shown on multiple lines.")
|
|
1582
|
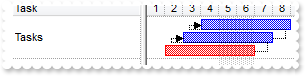
How can I expand an item once the user clicks the column's checkbox

' Fired after cell's state has been changed.
function CellStateChanged as v (Item  as  OLE::Exontrol.G2antt.1::HITEM, ColIndex  as  N)
	Dim var_Items as P
	oG2antt = topparent:CONTROL_ACTIVEX1.activex
	var_Items = oG2antt.Items
		' var_Items.ExpandItem(Item) = .f.
		oG2antt.TemplateDef = "dim var_Items,Item"
		oG2antt.TemplateDef = var_Items
		oG2antt.TemplateDef = Item
		oG2antt.Template = "var_Items.ExpandItem(Item) = CellState(Item,ColIndex)"

end function

Dim h as N
Dim hChild as N
Dim oG2antt as P
Dim var_Column as P
Dim var_Columns as P
Dim var_Items as P

oG2antt = topparent:CONTROL_ACTIVEX1.activex
oG2antt.BeginUpdate()
var_Columns = oG2antt.Columns
	var_Column = var_Columns.Add("")
		' var_Column.Def(0) = .t.
		oG2antt.TemplateDef = "dim var_Column"
		oG2antt.TemplateDef = var_Column
		oG2antt.Template = "var_Column.Def(0) = True"

		var_Column.AllowSizing = .f.
		var_Column.Width = 18
		var_Column.PartialCheck = .t.
	var_Columns.Add("Tasks")
oG2antt.ShowFocusRect = .f.
oG2antt.HasButtons = 0
oG2antt.TreeColumnIndex = 1
oG2antt.Indent = 14
oG2antt.ExpandOnDblClick = .f.
oG2antt.LinesAtRoot = 0
var_Items = oG2antt.Items
	h = var_Items.AddItem("")
	' var_Items.CellState(h,0) = 1
	oG2antt.TemplateDef = "dim var_Items,h"
	oG2antt.TemplateDef = var_Items
	oG2antt.TemplateDef = h
	oG2antt.Template = "var_Items.CellState(h,0) = 1"

	' var_Items.CellValue(h,1) = "Project"
	oG2antt.TemplateDef = "dim var_Items,h"
	oG2antt.TemplateDef = var_Items
	oG2antt.TemplateDef = h
	oG2antt.Template = "var_Items.CellValue(h,1) = `Project`"

	hChild = var_Items.InsertItem(h,,"")
	' var_Items.CellValue(hChild,1) = "Task 1"
	oG2antt.TemplateDef = "dim var_Items,hChild"
	oG2antt.TemplateDef = var_Items
	oG2antt.TemplateDef = hChild
	oG2antt.Template = "var_Items.CellValue(hChild,1) = `Task 1`"

	hChild = var_Items.InsertItem(h,,"")
	' var_Items.CellValue(hChild,1) = "Task 2"
	oG2antt.TemplateDef = "dim var_Items,hChild"
	oG2antt.TemplateDef = var_Items
	oG2antt.TemplateDef = hChild
	oG2antt.Template = "var_Items.CellValue(hChild,1) = `Task 2`"

	' var_Items.ExpandItem(h) = .t.
	oG2antt.TemplateDef = "dim var_Items,h"
	oG2antt.TemplateDef = var_Items
	oG2antt.TemplateDef = h
	oG2antt.Template = "var_Items.ExpandItem(h) = True"

oG2antt.EndUpdate()
|
|
1581
|
How can I define a column with check-box
Dim h as N
Dim hChild as N
Dim oG2antt as P
Dim var_Column as P
Dim var_Columns as P
Dim var_Items as P

oG2antt = topparent:CONTROL_ACTIVEX1.activex
oG2antt.BeginUpdate()
var_Columns = oG2antt.Columns
	var_Column = var_Columns.Add("")
		' var_Column.Def(0) = .t.
		oG2antt.TemplateDef = "dim var_Column"
		oG2antt.TemplateDef = var_Column
		oG2antt.Template = "var_Column.Def(0) = True"

		var_Column.AllowSizing = .f.
		var_Column.Width = 18
		var_Column.PartialCheck = .t.
	var_Columns.Add("Tasks")
oG2antt.ShowFocusRect = .f.
oG2antt.HasButtons = 0
oG2antt.TreeColumnIndex = 1
oG2antt.Indent = 14
oG2antt.ExpandOnDblClick = .f.
oG2antt.LinesAtRoot = 0
var_Items = oG2antt.Items
	h = var_Items.AddItem("")
	' var_Items.CellState(h,0) = 1
	oG2antt.TemplateDef = "dim var_Items,h"
	oG2antt.TemplateDef = var_Items
	oG2antt.TemplateDef = h
	oG2antt.Template = "var_Items.CellState(h,0) = 1"

	' var_Items.CellValue(h,1) = "Project"
	oG2antt.TemplateDef = "dim var_Items,h"
	oG2antt.TemplateDef = var_Items
	oG2antt.TemplateDef = h
	oG2antt.Template = "var_Items.CellValue(h,1) = `Project`"

	hChild = var_Items.InsertItem(h,,"")
	' var_Items.CellValue(hChild,1) = "Task 1"
	oG2antt.TemplateDef = "dim var_Items,hChild"
	oG2antt.TemplateDef = var_Items
	oG2antt.TemplateDef = hChild
	oG2antt.Template = "var_Items.CellValue(hChild,1) = `Task 1`"

	hChild = var_Items.InsertItem(h,,"")
	' var_Items.CellValue(hChild,1) = "Task 2"
	oG2antt.TemplateDef = "dim var_Items,hChild"
	oG2antt.TemplateDef = var_Items
	oG2antt.TemplateDef = hChild
	oG2antt.Template = "var_Items.CellValue(hChild,1) = `Task 2`"

	' var_Items.ExpandItem(h) = .t.
	oG2antt.TemplateDef = "dim var_Items,h"
	oG2antt.TemplateDef = var_Items
	oG2antt.TemplateDef = h
	oG2antt.Template = "var_Items.ExpandItem(h) = True"

oG2antt.EndUpdate()
|
|
1580
|
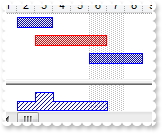
We need to know how it's possibile to have the bars on the same line and not in a different line
Dim h as N
Dim oG2antt as P
Dim var_Chart as P
Dim var_Items as P

oG2antt = topparent:CONTROL_ACTIVEX1.activex
oG2antt.BeginUpdate()
oG2antt.DrawGridLines = -1
var_Chart = oG2antt.Chart
	var_Chart.DrawGridLines = -1
	var_Chart.FirstVisibleDate = {01/01/2002}
	var_Chart.Bars.Item("Task").OverlaidType = 515 'exOverlaidBarsStackAutoArrange + exOverlaidBarsStack
	' var_Chart.PaneWidth(.f.) = 128
	oG2antt.TemplateDef = "dim var_Chart"
	oG2antt.TemplateDef = var_Chart
	oG2antt.Template = "var_Chart.PaneWidth(False) = 128"

oG2antt.Columns.Add("Task")
var_Items = oG2antt.Items
	h = var_Items.AddItem("Tasks")
	var_Items.AddBar(h,"Task",{01/02/2002},{01/07/2002},"A")
	var_Items.AddBar(h,"Task",{01/03/2002},{01/08/2002},"B")
	var_Items.AddBar(h,"Task",{01/04/2002},{01/09/2002},"C")
	' var_Items.ItemBar(h,"A",33) = 255
	oG2antt.TemplateDef = "dim var_Items,h"
	oG2antt.TemplateDef = var_Items
	oG2antt.TemplateDef = h
	oG2antt.Template = "var_Items.ItemBar(h,`A`,33) = 255"

	var_Items.AddLink("AB",h,"A",h,"B")
	var_Items.AddLink("BC",h,"B",h,"C")
oG2antt.EndUpdate()
|
|
1579
|
The Change event gets me the today date. How can I find what user typed
' Occurs when the user changes the cell's content.
function Change as v (Item  as  OLE::Exontrol.G2antt.1::HITEM, ColIndex  as  N, NewValue  as  A)
	oG2antt = topparent:CONTROL_ACTIVEX1.activex
	? "NewValue:"
	? NewValue
	? "EditingValue:"
	? oG2antt.EditingText
end function

Dim oG2antt as P
Dim var_Chart as local
Dim var_Editor as local

oG2antt = topparent:CONTROL_ACTIVEX1.activex
oG2antt.BeginUpdate()
' oG2antt.Chart.PaneWidth(.t.) = 0
var_Chart = oG2antt.Chart
oG2antt.TemplateDef = "dim var_Chart"
oG2antt.TemplateDef = var_Chart
oG2antt.Template = "var_Chart.PaneWidth(True) = 0"

' oG2antt.Columns.Add("Edit").Editor.EditType = 7
var_Editor = oG2antt.Columns.Add("Edit").Editor
oG2antt.TemplateDef = "dim var_Editor"
oG2antt.TemplateDef = var_Editor
oG2antt.Template = "var_Editor.EditType = 7"

oG2antt.Items.AddItem({01/01/2001})
oG2antt.EndUpdate()
|
|
1578
|
How can I add a footer row
Dim h as N
Dim oG2antt as P
Dim var_Items as P

oG2antt = topparent:CONTROL_ACTIVEX1.activex
oG2antt.ShowLockedItems = .t.
oG2antt.DrawGridLines = 2
oG2antt.Columns.Add("C1")
oG2antt.Columns.Add("C2")
var_Items = oG2antt.Items
	' var_Items.LockedItemCount(2) = 1
	oG2antt.TemplateDef = "dim var_Items"
	oG2antt.TemplateDef = var_Items
	oG2antt.Template = "var_Items.LockedItemCount(2) = 1"

	h = var_Items.LockedItem(2,0)
	' var_Items.ItemBackColor(h) = 8421504
	oG2antt.TemplateDef = "dim var_Items,h"
	oG2antt.TemplateDef = var_Items
	oG2antt.TemplateDef = h
	oG2antt.Template = "var_Items.ItemBackColor(h) = 8421504"

	' var_Items.ItemForeColor(h) = 16777215
	oG2antt.TemplateDef = "dim var_Items,h"
	oG2antt.TemplateDef = var_Items
	oG2antt.TemplateDef = h
	oG2antt.Template = "var_Items.ItemForeColor(h) = 16777215"

	' var_Items.CellValue(h,0) = "footer c1"
	oG2antt.TemplateDef = "dim var_Items,h"
	oG2antt.TemplateDef = var_Items
	oG2antt.TemplateDef = h
	oG2antt.Template = "var_Items.CellValue(h,0) = `footer c1`"

	' var_Items.CellValue(h,1) = "footer c2"
	oG2antt.TemplateDef = "dim var_Items,h"
	oG2antt.TemplateDef = var_Items
	oG2antt.TemplateDef = h
	oG2antt.Template = "var_Items.CellValue(h,1) = `footer c2`"

	' var_Items.CellValue(var_Items.AddItem("cell"),1) = "cell"
	oG2antt.TemplateDef = "dim var_Items"
	oG2antt.TemplateDef = var_Items
	oG2antt.Template = "var_Items.CellValue(AddItem(`cell`),1) = `cell`"
|
|
1577
|
How can I add a header row
Dim h as N
Dim oG2antt as P
Dim var_Items as P

oG2antt = topparent:CONTROL_ACTIVEX1.activex
oG2antt.ShowLockedItems = .t.
oG2antt.DrawGridLines = 2
oG2antt.Columns.Add("C1")
oG2antt.Columns.Add("C2")
var_Items = oG2antt.Items
	' var_Items.LockedItemCount(0) = 1
	oG2antt.TemplateDef = "dim var_Items"
	oG2antt.TemplateDef = var_Items
	oG2antt.Template = "var_Items.LockedItemCount(0) = 1"

	h = var_Items.LockedItem(0,0)
	' var_Items.ItemBackColor(h) = 8421504
	oG2antt.TemplateDef = "dim var_Items,h"
	oG2antt.TemplateDef = var_Items
	oG2antt.TemplateDef = h
	oG2antt.Template = "var_Items.ItemBackColor(h) = 8421504"

	' var_Items.ItemForeColor(h) = 16777215
	oG2antt.TemplateDef = "dim var_Items,h"
	oG2antt.TemplateDef = var_Items
	oG2antt.TemplateDef = h
	oG2antt.Template = "var_Items.ItemForeColor(h) = 16777215"

	' var_Items.CellValue(h,0) = "footer c1"
	oG2antt.TemplateDef = "dim var_Items,h"
	oG2antt.TemplateDef = var_Items
	oG2antt.TemplateDef = h
	oG2antt.Template = "var_Items.CellValue(h,0) = `footer c1`"

	' var_Items.CellValue(h,1) = "footer c2"
	oG2antt.TemplateDef = "dim var_Items,h"
	oG2antt.TemplateDef = var_Items
	oG2antt.TemplateDef = h
	oG2antt.Template = "var_Items.CellValue(h,1) = `footer c2`"

	' var_Items.CellValue(var_Items.AddItem("cell"),1) = "cell"
	oG2antt.TemplateDef = "dim var_Items"
	oG2antt.TemplateDef = var_Items
	oG2antt.Template = "var_Items.CellValue(AddItem(`cell`),1) = `cell`"
|
|
1576
|
How can I fix a column, while other sizable and fill the control's client
Dim oG2antt as P
Dim var_Column as P

oG2antt = topparent:CONTROL_ACTIVEX1.activex
oG2antt.ColumnAutoResize = .t.
oG2antt.Columns.Add("Sizable")
var_Column = oG2antt.Columns.Add("F")
	var_Column.AllowSizing = .f.
	var_Column.Width = 16
|
|
1575
|
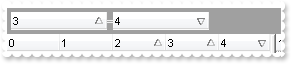
How can I programmatically add more columns to the sort bar and other to be sorted, but not included in the sort bar
Dim oG2antt as P
Dim var_Columns as P

oG2antt = topparent:CONTROL_ACTIVEX1.activex
oG2antt.SortBarVisible = .t.
var_Columns = oG2antt.Columns
	var_Columns.Add(0)
	var_Columns.Add(1)
	var_Columns.Add(2)
	var_Columns.Add(3)
	var_Columns.Add(4)
oG2antt.Layout = "multiplesort=\"C3:1 C4:2\";singlesort=\"C2:1\""
|
|
1574
|
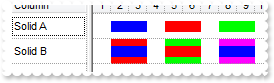
I'm using different bar types, in order to use different colours. The problem I'm having is that when two bars of different types overlap, and should in the histogram show as overallocated, they instead overlap here too, and show as single unit. Is there a way I can correctly show this as an overallocation
Dim h as N
Dim oG2antt as P
Dim var_Chart as P
Dim var_Items as P

oG2antt = topparent:CONTROL_ACTIVEX1.activex
var_Chart = oG2antt.Chart
	var_Chart.FirstVisibleDate = {01/01/2001}
	var_Chart.HistogramVisible = .t.
	var_Chart.HistogramHeight = 32
	var_Chart.Bars.Item("Task").HistogramPattern = 6
	' var_Chart.PaneWidth(.f.) = 128
	oG2antt.TemplateDef = "dim var_Chart"
	oG2antt.TemplateDef = var_Chart
	oG2antt.Template = "var_Chart.PaneWidth(False) = 128"

oG2antt.Columns.Add("Column")
var_Items = oG2antt.Items
	var_Items.AddBar(var_Items.AddItem("Item 1"),"Task",{01/02/2001},{01/04/2001})
	h = var_Items.AddItem("Item 2")
	var_Items.AddBar(h,"Task",{01/03/2001},{01/07/2001})
	' var_Items.ItemBar(h,"",33) = 255
	oG2antt.TemplateDef = "dim var_Items,h"
	oG2antt.TemplateDef = var_Items
	oG2antt.TemplateDef = h
	oG2antt.Template = "var_Items.ItemBar(h,``,33) = 255"

	var_Items.AddBar(var_Items.AddItem("Item 3"),"Task",{01/06/2001},{01/09/2001})
|
|
1573
|
Is it possible to assign a different EBN to a specified bar
Dim h as N
Dim oG2antt as P
Dim var_Appearance as P
Dim var_Chart as P
Dim var_Items as P

oG2antt = topparent:CONTROL_ACTIVEX1.activex
oG2antt.BeginUpdate()
var_Appearance = oG2antt.VisualAppearance
	var_Appearance.Add(1,"c:\exontrol\images\normal.ebn")
	var_Appearance.Add(2,"c:\exontrol\images\pushed.ebn")
var_Chart = oG2antt.Chart
	var_Chart.FirstVisibleDate = {01/01/2001}
	' var_Chart.PaneWidth(.f.) = 128
	oG2antt.TemplateDef = "dim var_Chart"
	oG2antt.TemplateDef = var_Chart
	oG2antt.Template = "var_Chart.PaneWidth(False) = 128"

oG2antt.Columns.Add("Tasks")
var_Items = oG2antt.Items
	h = var_Items.AddItem("Task 1")
	var_Items.AddBar(h,"Task",{01/02/2001},{01/04/2001})
	h = var_Items.AddItem("Task 2")
	var_Items.AddBar(h,"Task",{01/02/2001},{01/04/2001})
	' var_Items.ItemBar(h,"",33) = 255
	oG2antt.TemplateDef = "dim var_Items,h"
	oG2antt.TemplateDef = var_Items
	oG2antt.TemplateDef = h
	oG2antt.Template = "var_Items.ItemBar(h,``,33) = 255"

	h = var_Items.AddItem("Task 3")
	var_Items.AddBar(h,"Task",{01/02/2001},{01/04/2001})
	' var_Items.ItemBar(h,"",33) = 16777216
	oG2antt.TemplateDef = "dim var_Items,h"
	oG2antt.TemplateDef = var_Items
	oG2antt.TemplateDef = h
	oG2antt.Template = "var_Items.ItemBar(h,``,33) = 16777216"

	h = var_Items.AddItem("Task 4")
	var_Items.AddBar(h,"Task",{01/02/2001},{01/04/2001})
	' var_Items.ItemBar(h,"",33) = 16777471
	oG2antt.TemplateDef = "dim var_Items,h"
	oG2antt.TemplateDef = var_Items
	oG2antt.TemplateDef = h
	oG2antt.Template = "var_Items.ItemBar(h,``,33) = 16777471"

	h = var_Items.AddItem("Task 5")
	var_Items.AddBar(h,"Task",{01/02/2001},{01/04/2001})
	' var_Items.ItemBar(h,"",33) = 33619967
	oG2antt.TemplateDef = "dim var_Items,h"
	oG2antt.TemplateDef = var_Items
	oG2antt.TemplateDef = h
	oG2antt.Template = "var_Items.ItemBar(h,``,33) = 33619967"

oG2antt.EndUpdate()
|
|
1572
|
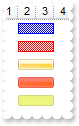
How can I provide a mask for a date column
' Occurs when the user changes the cell's content.
function Change as v (Item  as  OLE::Exontrol.G2antt.1::HITEM, ColIndex  as  N, NewValue  as  A)
	oG2antt = topparent:CONTROL_ACTIVEX1.activex
	? "Prev Value "
	? oG2antt.Items.CellValue(Item,ColIndex)
	? "Check and Update the NewValue"
	? NewValue
	NewValue = {01/01/2001}
end function

Dim oG2antt as P
Dim var_Column as P
Dim var_Editor as P

oG2antt = topparent:CONTROL_ACTIVEX1.activex
oG2antt.BeginUpdate()
oG2antt.MarkSearchColumn = .f.
var_Column = oG2antt.Columns.Add("Date")
	var_Column.FormatColumn = "day(value) + `/` + month(value) + `/` + year(value)"
	var_Editor = var_Column.Editor
		var_Editor.EditType = 7
		var_Editor.Mask = "{1,12}\/{1,31}\/{1,2099}"
oG2antt.Items.AddItem({01/01/2001})
oG2antt.EndUpdate()
|
|
1571
|
I am trying to introduce a custom tool tip to those particular cells. I have it working and I know I can style the font etc. however, what I would like to do is style the tooltip container itself like add some padding or add a border color. Is this possible
Dim oG2antt as P
Dim var_Column as local

oG2antt = topparent:CONTROL_ACTIVEX1.activex
oG2antt.ToolTipDelay = 1
oG2antt.ToolTipWidth = 364
oG2antt.VisualAppearance.Add(1,"C:\Program Files\Exontrol\ExG2antt\Sample\EBN\frame.ebn")
oG2antt.Template = "Background(64) = 16777216" // oG2antt.Background(64) = 16777216
' oG2antt.Columns.Add("tootip").ToolTip = "this is a tooltip assigned to a column"
var_Column = oG2antt.Columns.Add("tootip")
oG2antt.TemplateDef = "dim var_Column"
oG2antt.TemplateDef = var_Column
oG2antt.Template = "var_Column.ToolTip = `this is a tooltip assigned to a column`"
|
|
1570
|
Is it possible to edit a float number without using of e/E/d/D (exponent) and +/- (signs) characters
Dim oG2antt as P
Dim var_Editor as P

oG2antt = topparent:CONTROL_ACTIVEX1.activex
var_Editor = oG2antt.Columns.Add("Edit").Editor
	var_Editor.EditType = 1
	var_Editor.Numeric = 770 'exDisableSigns + exFloatInteger
oG2antt.Items.AddItem(1.22)
|
|
1569
|
How can I edit a float number with no using of e/E/d/D and + character
Dim oG2antt as P
Dim var_Editor as P

oG2antt = topparent:CONTROL_ACTIVEX1.activex
var_Editor = oG2antt.Columns.Add("Edit").Editor
	var_Editor.EditType = 1
	var_Editor.Numeric = 258 'exDisablePlus + exFloatInteger
oG2antt.Items.AddItem(1.22)
|
|
1568
|
Is it possible to edit a float number with no using of e/E/d/D (exponent) characters
Dim oG2antt as P
Dim var_Editor as P

oG2antt = topparent:CONTROL_ACTIVEX1.activex
var_Editor = oG2antt.Columns.Add("Edit").Editor
	var_Editor.EditType = 1
	var_Editor.Numeric = 2
oG2antt.Items.AddItem(1.22)
|
|
1567
|
How can I edit an integer with no using of +/- signs
Dim oG2antt as P
Dim var_Editor as P

oG2antt = topparent:CONTROL_ACTIVEX1.activex
var_Editor = oG2antt.Columns.Add("Edit").Editor
	var_Editor.EditType = 1
	var_Editor.Numeric = 1023 'fc + exDisableSigns + exFloatInteger + exFloat
oG2antt.Items.AddItem(1)
|
|
1566
|
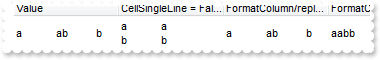
When I'm trying to show string with "line break" character (vbCrLF) in a textbox, it shows 2 squares. Is there any way to hide these squares
Dim oG2antt as P
Dim var_Column as P
Dim var_Column1 as P
Dim var_Column2 as P
Dim var_Columns as P
Dim var_Items as P

oG2antt = topparent:CONTROL_ACTIVEX1.activex
var_Columns = oG2antt.Columns
	var_Columns.Add("Value")
	var_Column = var_Columns.Add("CellSingleLine = False")
		var_Column.ComputedField = "%0"
		' var_Column.Def(16) = .f.
		oG2antt.TemplateDef = "dim var_Column"
		oG2antt.TemplateDef = var_Column
		oG2antt.Template = "var_Column.Def(16) = False"

	var_Column1 = var_Columns.Add("FormatColumn/replace CRLF")
		var_Column1.ComputedField = "%0"
		var_Column1.FormatColumn = "value replace `\r\n` with ``"
	var_Column2 = var_Columns.Add("FormatColumn/replace TAB,CRLF")
		var_Column2.ComputedField = "%0"
		var_Column2.FormatColumn = "(value replace `\t` with ``) replace `\r\n` with ``"
var_Items = oG2antt.Items
	var_Items.AddItem("a\ta\r\nb\tb")
|
|
1565
|
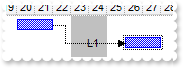
I am using the Chart.ShowLinksColor property, the question is it is possible to prevent changing the bar's color
Dim h1 as N
Dim h2 as N
Dim h3 as N
Dim oG2antt as P
Dim var_Chart as P
Dim var_Items as P

oG2antt = topparent:CONTROL_ACTIVEX1.activex
oG2antt.BeginUpdate()
oG2antt.DefaultItemHeight = 24
oG2antt.Columns.Add("Task")
var_Chart = oG2antt.Chart
	var_Chart.LevelCount = 2
	var_Chart.FirstVisibleDate = {01/01/2001}
	' var_Chart.PaneWidth(.f.) = 48
	oG2antt.TemplateDef = "dim var_Chart"
	oG2antt.TemplateDef = var_Chart
	oG2antt.Template = "var_Chart.PaneWidth(False) = 48"

	var_Chart.NonworkingDays = 0
	var_Chart.LinksStyle = 0
	' var_Chart.ShowLinksColor(17 'exUpdateColorLinksOnly + exShowLinksStartFrom) = 255
	oG2antt.TemplateDef = "dim var_Chart"
	oG2antt.TemplateDef = var_Chart
	oG2antt.Template = "var_Chart.ShowLinksColor(17) = 255"

	' var_Chart.ShowLinksColor(18 'exUpdateColorLinksOnly + exShowLinksEndTo) = 65280
	oG2antt.TemplateDef = "dim var_Chart"
	oG2antt.TemplateDef = var_Chart
	oG2antt.Template = "var_Chart.ShowLinksColor(18) = 65280"

var_Items = oG2antt.Items
	h1 = var_Items.AddItem("Task 1")
	var_Items.AddBar(h1,"Task",{01/02/2001},{01/04/2001},"")
	h2 = var_Items.AddItem("Task 2")
	var_Items.AddBar(h2,"Task",{01/02/2001},{01/04/2001},"")
	' var_Items.ItemBar(h2,"",257) = .t.
	oG2antt.TemplateDef = "dim var_Items,h2"
	oG2antt.TemplateDef = var_Items
	oG2antt.TemplateDef = h2
	oG2antt.Template = "var_Items.ItemBar(h2,``,257) = True"

	var_Items.AddLink("L1",h1,"",h2,"")
	h3 = var_Items.AddItem("Task 3")
	var_Items.AddBar(h3,"Task",{01/02/2001},{01/04/2001},"")
	var_Items.AddLink("L2",h2,"",h3,"")
	var_Items.SchedulePDM(0,"")
oG2antt.EndUpdate()
|
|
1564
|
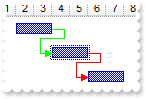
Apparently, the links are shown on the back. Is there any option to bring them in front
Dim h1 as N
Dim h2 as N
Dim oG2antt as P
Dim var_Chart as P
Dim var_Items as P

oG2antt = topparent:CONTROL_ACTIVEX1.activex
oG2antt.BeginUpdate()
oG2antt.Columns.Add("Tasks")
var_Chart = oG2antt.Chart
	var_Chart.FirstVisibleDate = {09/19/2006}
	' var_Chart.PaneWidth(.f.) = 64
	oG2antt.TemplateDef = "dim var_Chart"
	oG2antt.TemplateDef = var_Chart
	oG2antt.Template = "var_Chart.PaneWidth(0) = 64"

	var_Chart.NonworkingDaysPattern = 1
	var_Chart.ShowLinks = 17 'exShowLinksFront + exShowExtendedLinks
var_Items = oG2antt.Items
	h1 = var_Items.AddItem("Task 1")
	var_Items.AddBar(h1,"Task",{09/20/2006},{09/22/2006})
	h2 = var_Items.AddItem("Task 2")
	var_Items.AddBar(h2,"Task",{09/26/2006},{09/28/2006})
	' var_Items.ItemBar(h2,"",257) = .t.
	oG2antt.TemplateDef = "dim var_Items,h2"
	oG2antt.TemplateDef = var_Items
	oG2antt.TemplateDef = h2
	oG2antt.Template = "var_Items.ItemBar(h2,``,257) = True"

	var_Items.AddLink("L1",h1,"",h2,"")
	' var_Items.Link("L1",12) = "L1"
	oG2antt.TemplateDef = "dim var_Items"
	oG2antt.TemplateDef = var_Items
	oG2antt.Template = "var_Items.Link(`L1`,12) = `L1`"

oG2antt.EndUpdate()
|
|
1563
|
How can I enable the extended links feature
Dim h1 as N
Dim h2 as N
Dim h3 as N
Dim oG2antt as P
Dim var_Chart as P
Dim var_Items as P

oG2antt = topparent:CONTROL_ACTIVEX1.activex
oG2antt.BeginUpdate()
oG2antt.DefaultItemHeight = 24
oG2antt.Columns.Add("Task")
var_Chart = oG2antt.Chart
	var_Chart.LevelCount = 2
	var_Chart.FirstVisibleDate = {01/01/2001}
	' var_Chart.PaneWidth(.f.) = 48
	oG2antt.TemplateDef = "dim var_Chart"
	oG2antt.TemplateDef = var_Chart
	oG2antt.Template = "var_Chart.PaneWidth(False) = 48"

	var_Chart.NonworkingDays = 0
	var_Chart.LinksStyle = 0
	var_Chart.ShowLinks = 1
var_Items = oG2antt.Items
	h1 = var_Items.AddItem("Task 1")
	var_Items.AddBar(h1,"Task",{01/02/2001},{01/04/2001},"")
	h2 = var_Items.AddItem("Task 2")
	var_Items.AddBar(h2,"Task",{01/02/2001},{01/04/2001},"")
	var_Items.AddLink("L1",h1,"",h2,"")
	h3 = var_Items.AddItem("Task 3")
	var_Items.AddBar(h3,"Task",{01/02/2001},{01/04/2001},"")
	var_Items.AddLink("L2",h3,"",h2,"")
	var_Items.SchedulePDM(0,"")
oG2antt.EndUpdate()
|
|
1562
|
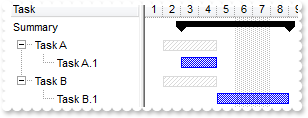
How do I count all bars in the chart
Dim hSummary as N
Dim hTask as N
Dim oG2antt as P
Dim var_Chart as P
Dim var_Items as P

oG2antt = topparent:CONTROL_ACTIVEX1.activex
oG2antt.BeginUpdate()
oG2antt.Columns.Add("Task")
var_Chart = oG2antt.Chart
	' var_Chart.PaneWidth(.f.) = 128
	oG2antt.TemplateDef = "dim var_Chart"
	oG2antt.TemplateDef = var_Chart
	oG2antt.Template = "var_Chart.PaneWidth(False) = 128"

	var_Chart.FirstVisibleDate = {01/01/2001}
var_Items = oG2antt.Items
	hSummary = var_Items.AddItem("Task")
	var_Items.AddBar(hSummary,"Task",{01/02/2001},{01/05/2001},"K1")
	hTask = var_Items.InsertItem(hSummary,,"Task A")
	var_Items.AddBar(hTask,"Task",{01/02/2001},{01/05/2001},"K1")
	var_Items.AddBar(var_Items.InsertItem(hTask,,"Task A.1"),"Task",{01/03/2001},{01/05/2001},"K11")
	var_Items.AddBar(var_Items.InsertItem(hTask,,"Task A.2"),"Task",{01/03/2001},{01/05/2001},"K12")
	hTask = var_Items.InsertItem(hSummary,,"Task B")
	var_Items.AddBar(hTask,"Task",{01/02/2001},{01/05/2001},"K2")
	hTask = var_Items.InsertItem(hTask,,"Task B.1")
	var_Items.AddBar(hTask,"Task",{01/05/2001},{01/09/2001},"K21")
	' var_Items.ExpandItem(0) = .t.
	oG2antt.TemplateDef = "dim var_Items"
	oG2antt.TemplateDef = var_Items
	oG2antt.Template = "var_Items.ExpandItem(0) = True"

	? "Count: "
	? var_Items.ItemBar(0,"<*>",256)
oG2antt.EndUpdate()
|
|
1561
|
Is there any property to count the all child bars of a specified item ( all descendents )
Dim hSummary as N
Dim hTask as N
Dim oG2antt as P
Dim var_Bar as local
Dim var_Chart as P
Dim var_Items as P

oG2antt = topparent:CONTROL_ACTIVEX1.activex
oG2antt.BeginUpdate()
oG2antt.Columns.Add("Task")
var_Chart = oG2antt.Chart
	' var_Chart.PaneWidth(.f.) = 128
	oG2antt.TemplateDef = "dim var_Chart"
	oG2antt.TemplateDef = var_Chart
	oG2antt.Template = "var_Chart.PaneWidth(False) = 128"

	var_Chart.FirstVisibleDate = {01/01/2001}
	' var_Chart.Bars.Copy("Task","CountTask").Color = 65280
	var_Bar = var_Chart.Bars.Copy("Task","CountTask")
	oG2antt.TemplateDef = "dim var_Bar"
	oG2antt.TemplateDef = var_Bar
	oG2antt.Template = "var_Bar.Color = 65280"

var_Items = oG2antt.Items
	hSummary = var_Items.AddItem("Project")
	' var_Items.ItemBold(hSummary) = .t.
	oG2antt.TemplateDef = "dim var_Items,hSummary"
	oG2antt.TemplateDef = var_Items
	oG2antt.TemplateDef = hSummary
	oG2antt.Template = "var_Items.ItemBold(hSummary) = True"

	hTask = var_Items.InsertItem(hSummary,,"Task A")
	var_Items.AddBar(hTask,"CountTask",{01/02/2001},{01/05/2001},"K1")
	var_Items.AddBar(var_Items.InsertItem(hTask,,"Task A.1"),"CountTask",{01/03/2001},{01/05/2001},"K11")
	var_Items.AddBar(var_Items.InsertItem(hTask,,"Task A.2"),"CountTask",{01/03/2001},{01/05/2001},"K12")
	hTask = var_Items.InsertItem(hSummary,,"Task B")
	var_Items.AddBar(hTask,"CountTask",{01/02/2001},{01/05/2001},"K2")
	hTask = var_Items.InsertItem(hTask,,"Task B.1")
	var_Items.AddBar(hTask,"CountTask",{01/05/2001},{01/09/2001},"K21")
	' var_Items.ExpandItem(0) = .t.
	oG2antt.TemplateDef = "dim var_Items"
	oG2antt.TemplateDef = var_Items
	oG2antt.Template = "var_Items.ExpandItem(0) = True"

	var_Items.DefaultItem = var_Items.ItemByIndex(0)
	? "Count: "
	? var_Items.ItemBar(-3,"<*>",256)
	var_Items.DefaultItem = 0
oG2antt.EndUpdate()
|
|
1560
|
Is there any property to count the child bars of a specified item ( leaf descendents )
Dim hSummary as N
Dim hTask as N
Dim oG2antt as P
Dim var_Bar as local
Dim var_Chart as P
Dim var_Items as P

oG2antt = topparent:CONTROL_ACTIVEX1.activex
oG2antt.BeginUpdate()
oG2antt.Columns.Add("Task")
var_Chart = oG2antt.Chart
	' var_Chart.PaneWidth(.f.) = 128
	oG2antt.TemplateDef = "dim var_Chart"
	oG2antt.TemplateDef = var_Chart
	oG2antt.Template = "var_Chart.PaneWidth(False) = 128"

	var_Chart.FirstVisibleDate = {01/01/2001}
	' var_Chart.Bars.Copy("Task","CountTask").Color = 65280
	var_Bar = var_Chart.Bars.Copy("Task","CountTask")
	oG2antt.TemplateDef = "dim var_Bar"
	oG2antt.TemplateDef = var_Bar
	oG2antt.Template = "var_Bar.Color = 65280"

var_Items = oG2antt.Items
	hSummary = var_Items.AddItem("Project")
	' var_Items.ItemBold(hSummary) = .t.
	oG2antt.TemplateDef = "dim var_Items,hSummary"
	oG2antt.TemplateDef = var_Items
	oG2antt.TemplateDef = hSummary
	oG2antt.Template = "var_Items.ItemBold(hSummary) = True"

	hTask = var_Items.InsertItem(hSummary,,"Task A")
	var_Items.AddBar(hTask,"Task",{01/02/2001},{01/05/2001},"K1")
	var_Items.AddBar(var_Items.InsertItem(hTask,,"Task A.1"),"CountTask",{01/03/2001},{01/05/2001},"K11")
	var_Items.AddBar(var_Items.InsertItem(hTask,,"Task A.2"),"CountTask",{01/03/2001},{01/05/2001},"K12")
	hTask = var_Items.InsertItem(hSummary,,"Task B")
	var_Items.AddBar(hTask,"Task",{01/02/2001},{01/05/2001},"K2")
	hTask = var_Items.InsertItem(hTask,,"Task B.1")
	var_Items.AddBar(hTask,"CountTask",{01/05/2001},{01/09/2001},"K21")
	' var_Items.ExpandItem(0) = .t.
	oG2antt.TemplateDef = "dim var_Items"
	oG2antt.TemplateDef = var_Items
	oG2antt.Template = "var_Items.ExpandItem(0) = True"

	var_Items.DefaultItem = var_Items.ItemByIndex(0)
	? "Count: "
	? var_Items.ItemBar(-2,"<*>",256)
	var_Items.DefaultItem = 0
oG2antt.EndUpdate()
|
|
1559
|
Is there any property to count the child bars of a specified item ( direct descendents )
Dim hSummary as N
Dim hTask as N
Dim oG2antt as P
Dim var_Bar as local
Dim var_Chart as P
Dim var_Items as P

oG2antt = topparent:CONTROL_ACTIVEX1.activex
oG2antt.BeginUpdate()
oG2antt.Columns.Add("Task")
var_Chart = oG2antt.Chart
	' var_Chart.PaneWidth(.f.) = 128
	oG2antt.TemplateDef = "dim var_Chart"
	oG2antt.TemplateDef = var_Chart
	oG2antt.Template = "var_Chart.PaneWidth(False) = 128"

	var_Chart.FirstVisibleDate = {01/01/2001}
	' var_Chart.Bars.Copy("Task","CountTask").Color = 65280
	var_Bar = var_Chart.Bars.Copy("Task","CountTask")
	oG2antt.TemplateDef = "dim var_Bar"
	oG2antt.TemplateDef = var_Bar
	oG2antt.Template = "var_Bar.Color = 65280"

var_Items = oG2antt.Items
	hSummary = var_Items.AddItem("Project")
	' var_Items.ItemBold(hSummary) = .t.
	oG2antt.TemplateDef = "dim var_Items,hSummary"
	oG2antt.TemplateDef = var_Items
	oG2antt.TemplateDef = hSummary
	oG2antt.Template = "var_Items.ItemBold(hSummary) = True"

	hTask = var_Items.InsertItem(hSummary,,"Task A")
	var_Items.AddBar(hTask,"CountTask",{01/02/2001},{01/05/2001},"K1")
	var_Items.AddBar(var_Items.InsertItem(hTask,,"Task A.1"),"Task",{01/03/2001},{01/05/2001},"K11")
	var_Items.AddBar(var_Items.InsertItem(hTask,,"Task A.2"),"Task",{01/03/2001},{01/05/2001},"K12")
	hTask = var_Items.InsertItem(hSummary,,"Task B")
	var_Items.AddBar(hTask,"CountTask",{01/02/2001},{01/05/2001},"K2")
	hTask = var_Items.InsertItem(hTask,,"Task B.1")
	var_Items.AddBar(hTask,"Task",{01/05/2001},{01/09/2001},"K21")
	' var_Items.ExpandItem(0) = .t.
	oG2antt.TemplateDef = "dim var_Items"
	oG2antt.TemplateDef = var_Items
	oG2antt.Template = "var_Items.ExpandItem(0) = True"

	var_Items.DefaultItem = var_Items.ItemByIndex(0)
	? "Count: "
	? var_Items.ItemBar(-1,"<*>",256)
	var_Items.DefaultItem = 0
oG2antt.EndUpdate()
|
|
1558
|
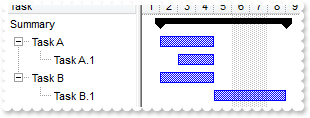
How can I define all child items to belong to a summary bar (DefineSummaryBars-3)
Dim hSummary as N
Dim hTask as N
Dim oG2antt as P
Dim var_Chart as P
Dim var_Items as P

oG2antt = topparent:CONTROL_ACTIVEX1.activex
oG2antt.BeginUpdate()
oG2antt.Columns.Add("Task")
var_Chart = oG2antt.Chart
	' var_Chart.PaneWidth(.f.) = 128
	oG2antt.TemplateDef = "dim var_Chart"
	oG2antt.TemplateDef = var_Chart
	oG2antt.Template = "var_Chart.PaneWidth(False) = 128"

	var_Chart.FirstVisibleDate = {01/01/2001}
var_Items = oG2antt.Items
	hSummary = var_Items.AddItem("Summary")
	var_Items.AddBar(hSummary,"Summary",{01/02/2001},{01/02/2001},"")
	hTask = var_Items.InsertItem(hSummary,,"Task A")
	var_Items.AddBar(hTask,"Task",{01/02/2001},{01/05/2001},"K1")
	hTask = var_Items.InsertItem(hTask,,"Task A.1")
	var_Items.AddBar(hTask,"Task",{01/03/2001},{01/05/2001},"K11")
	hTask = var_Items.InsertItem(hSummary,,"Task B")
	var_Items.AddBar(hTask,"Task",{01/02/2001},{01/05/2001},"K2")
	hTask = var_Items.InsertItem(hTask,,"Task B.1")
	var_Items.AddBar(hTask,"Task",{01/05/2001},{01/09/2001},"K21")
	var_Items.DefineSummaryBars(hSummary,"",-3,"<K*>")
	' var_Items.ExpandItem(0) = .t.
	oG2antt.TemplateDef = "dim var_Items"
	oG2antt.TemplateDef = var_Items
	oG2antt.Template = "var_Items.ExpandItem(0) = True"

oG2antt.EndUpdate()
|
|
1557
|
Can I define automatically the leaf descendents of the summary bar (DefineSummaryBars-2)
Dim hSummary as N
Dim hTask as N
Dim oG2antt as P
Dim var_Chart as P
Dim var_Items as P

oG2antt = topparent:CONTROL_ACTIVEX1.activex
oG2antt.BeginUpdate()
oG2antt.Columns.Add("Task")
var_Chart = oG2antt.Chart
	' var_Chart.PaneWidth(.f.) = 128
	oG2antt.TemplateDef = "dim var_Chart"
	oG2antt.TemplateDef = var_Chart
	oG2antt.Template = "var_Chart.PaneWidth(False) = 128"

	var_Chart.FirstVisibleDate = {01/01/2001}
var_Items = oG2antt.Items
	hSummary = var_Items.AddItem("Summary")
	var_Items.AddBar(hSummary,"Summary",{01/02/2001},{01/02/2001},"")
	hTask = var_Items.InsertItem(hSummary,,"Task A")
	var_Items.AddBar(hTask,"1Task",{01/02/2001},{01/05/2001},"K1")
	hTask = var_Items.InsertItem(hTask,,"Task A.1")
	var_Items.AddBar(hTask,"Task",{01/03/2001},{01/05/2001},"K11")
	hTask = var_Items.InsertItem(hSummary,,"Task B")
	var_Items.AddBar(hTask,"1Task",{01/02/2001},{01/05/2001},"K2")
	hTask = var_Items.InsertItem(hTask,,"Task B.1")
	var_Items.AddBar(hTask,"Task",{01/05/2001},{01/09/2001},"K21")
	var_Items.DefineSummaryBars(hSummary,"",-2,"<K*>")
	' var_Items.ExpandItem(0) = .t.
	oG2antt.TemplateDef = "dim var_Items"
	oG2antt.TemplateDef = var_Items
	oG2antt.Template = "var_Items.ExpandItem(0) = True"

oG2antt.EndUpdate()
|
|
1556
|
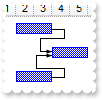
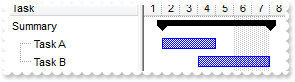
How can I assign the childs bars to a summary bar (DefineSummaryBars-1)
Dim hSummary as N
Dim hTask as N
Dim oG2antt as P
Dim var_Chart as P
Dim var_Items as P

oG2antt = topparent:CONTROL_ACTIVEX1.activex
oG2antt.BeginUpdate()
oG2antt.Columns.Add("Task")
var_Chart = oG2antt.Chart
	' var_Chart.PaneWidth(.f.) = 128
	oG2antt.TemplateDef = "dim var_Chart"
	oG2antt.TemplateDef = var_Chart
	oG2antt.Template = "var_Chart.PaneWidth(False) = 128"

	var_Chart.FirstVisibleDate = {01/01/2001}
var_Items = oG2antt.Items
	hSummary = var_Items.AddItem("Summary")
	var_Items.AddBar(hSummary,"Summary",{01/02/2001},{01/02/2001},"")
	hTask = var_Items.InsertItem(hSummary,,"Task A")
	var_Items.AddBar(hTask,"Task",{01/02/2001},{01/05/2001},"K1")
	hTask = var_Items.InsertItem(hSummary,,"Task B")
	var_Items.AddBar(hTask,"Task",{01/04/2001},{01/08/2001},"K2")
	' var_Items.ExpandItem(hSummary) = .t.
	oG2antt.TemplateDef = "dim var_Items,hSummary"
	oG2antt.TemplateDef = var_Items
	oG2antt.TemplateDef = hSummary
	oG2antt.Template = "var_Items.ExpandItem(hSummary) = True"

	var_Items.DefineSummaryBars(hSummary,"",-1,"<*>")
oG2antt.EndUpdate()
|
|
1555
|
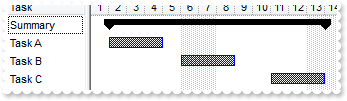
Is it possible to define a summary bar to include all bars in the chart (DefineSummaryBars-0)
Dim hSummary as N
Dim oG2antt as P
Dim var_Chart as P
Dim var_Items as P

oG2antt = topparent:CONTROL_ACTIVEX1.activex
oG2antt.BeginUpdate()
oG2antt.Columns.Add("Task")
var_Chart = oG2antt.Chart
	' var_Chart.PaneWidth(.f.) = 128
	oG2antt.TemplateDef = "dim var_Chart"
	oG2antt.TemplateDef = var_Chart
	oG2antt.Template = "var_Chart.PaneWidth(False) = 128"

	var_Chart.FirstVisibleDate = {01/01/2001}
var_Items = oG2antt.Items
	hSummary = var_Items.AddItem("Summary")
	var_Items.AddBar(hSummary,"Summary",{01/02/2001},{01/02/2001},"summary")
	var_Items.AddBar(var_Items.AddItem("Task A"),"Task",{01/02/2001},{01/05/2001},"K1")
	var_Items.AddBar(var_Items.AddItem("Task B"),"Task",{01/06/2001},{01/09/2001},"K2")
	var_Items.AddBar(var_Items.AddItem("Task C"),"Task",{01/11/2001},{01/14/2001},"K3")
	var_Items.DefineSummaryBars(hSummary,"summary",0,"<K*>")
oG2antt.EndUpdate()
|
|
1554
|
Is there any way to "unselect" radio group
' Occurs when the user dblclk the left mouse button over an object.
function DblClick as v (Shift  as  N, X  as  OLE::Exontrol.G2antt.1::OLE_XPOS_PIXELS, Y  as  OLE::Exontrol.G2antt.1::OLE_YPOS_PIXELS)
	Dim h as N
	Dim var_Items as P
	oG2antt = topparent:CONTROL_ACTIVEX1.activex
	var_Items = oG2antt.Items
		h = var_Items.CellChecked(1234)
		' var_Items.CellHasCheckBox(0,h) = .t.
		oG2antt.TemplateDef = "dim var_Items,h"
		oG2antt.TemplateDef = var_Items
		oG2antt.TemplateDef = h
		oG2antt.Template = "var_Items.CellHasCheckBox(0,h) = True"
		' var_Items.CellState(0,h) = 0
		oG2antt.TemplateDef = "dim var_Items,h"
		oG2antt.TemplateDef = var_Items
		oG2antt.TemplateDef = h
		oG2antt.Template = "var_Items.CellState(0,h) = 0"
		' var_Items.CellHasCheckBox(0,h) = .f.
		oG2antt.TemplateDef = "dim var_Items,h"
		oG2antt.TemplateDef = var_Items
		oG2antt.TemplateDef = h
		oG2antt.Template = "var_Items.CellHasCheckBox(0,h) = False"

end function

' Fired after a new item has been selected.
function SelectionChanged as v ()
	Dim var_Items as P
	oG2antt = topparent:CONTROL_ACTIVEX1.activex
	var_Items = oG2antt.Items
		' var_Items.CellState(var_Items.FocusItem,0) = 1
		oG2antt.TemplateDef = "dim var_Items"
		oG2antt.TemplateDef = var_Items
		oG2antt.Template = "var_Items.CellState(FocusItem,0) = 1"

end function

Dim h as N
Dim oG2antt as P
Dim var_Items as P

oG2antt = topparent:CONTROL_ACTIVEX1.activex
oG2antt.MarkSearchColumn = .f.
oG2antt.SelBackColor = 8454143
oG2antt.SelForeColor = 0
oG2antt.Columns.Add("Default")
var_Items = oG2antt.Items
	h = var_Items.AddItem("Radio 1")
	' var_Items.CellHasRadioButton(h,0) = .t.
	oG2antt.TemplateDef = "dim var_Items,h"
	oG2antt.TemplateDef = var_Items
	oG2antt.TemplateDef = h
	oG2antt.Template = "var_Items.CellHasRadioButton(h,0) = True"

	' var_Items.CellRadioGroup(h,0) = 1234
	oG2antt.TemplateDef = "dim var_Items,h"
	oG2antt.TemplateDef = var_Items
	oG2antt.TemplateDef = h
	oG2antt.Template = "var_Items.CellRadioGroup(h,0) = 1234"

	h = var_Items.AddItem("Radio 2")
	' var_Items.CellHasRadioButton(h,0) = .t.
	oG2antt.TemplateDef = "dim var_Items,h"
	oG2antt.TemplateDef = var_Items
	oG2antt.TemplateDef = h
	oG2antt.Template = "var_Items.CellHasRadioButton(h,0) = True"

	' var_Items.CellRadioGroup(h,0) = 1234
	oG2antt.TemplateDef = "dim var_Items,h"
	oG2antt.TemplateDef = var_Items
	oG2antt.TemplateDef = h
	oG2antt.Template = "var_Items.CellRadioGroup(h,0) = 1234"

	' var_Items.CellState(h,0) = 1
	oG2antt.TemplateDef = "dim var_Items,h"
	oG2antt.TemplateDef = var_Items
	oG2antt.TemplateDef = h
	oG2antt.Template = "var_Items.CellState(h,0) = 1"

	h = var_Items.AddItem("Radio 3")
	' var_Items.CellHasRadioButton(h,0) = .t.
	oG2antt.TemplateDef = "dim var_Items,h"
	oG2antt.TemplateDef = var_Items
	oG2antt.TemplateDef = h
	oG2antt.Template = "var_Items.CellHasRadioButton(h,0) = True"

	' var_Items.CellRadioGroup(h,0) = 1234
	oG2antt.TemplateDef = "dim var_Items,h"
	oG2antt.TemplateDef = var_Items
	oG2antt.TemplateDef = h
	oG2antt.Template = "var_Items.CellRadioGroup(h,0) = 1234"
|
|
1553
|
The Column.Alignment property does not seem to work for cells with images in them. What can be done
Dim oG2antt as P
Dim var_Column as P
Dim var_Items as P

oG2antt = topparent:CONTROL_ACTIVEX1.activex
oG2antt.BeginUpdate()
oG2antt.Images("gBJJgBAIDAAGAAEAAQhYAf8Pf4hh0QihCJo2AEZjQAjEZFEaIEaEEaAIAkcbk0olUrlktl0vmExmUzmk1m03nE5nU7nk9n0/oFBoVDolFo1HpFJpVLplNp1PqFRqVTqlVq1XrFZrVbrldr1fsFhsVjslls1ntFptVrtltt1vuFxuVzul1u13vF5vV7vl9v1/wGBwWDwmFw2HxGJxWLxmNx0xiFdyOTh8Tf9ZymXx+QytcyNgz8r0OblWjyWds+m0ka1Vf1ta1+r1mos2xrG2xeZ0+a0W0qOx3GO4NV3WeyvD2XJ5XL5nN51aiw+lfSj0gkUkAEllHanHI5j/cHg8EZf7w8vl8j4f/qfEZeB09/vjLAB30+kZQAP/P5/H6/yNAOAEAwCjMBwFAEDwJBMDwLBYAP2/8Hv8/gAGAD8LQs9w/nhDY/oygIA=")
oG2antt.TreeColumnIndex = -1
oG2antt.DrawGridLines = -1
oG2antt.HeaderHeight = 24
oG2antt.DefaultItemHeight = 24
var_Column = oG2antt.Columns.Add("Image")
	var_Column.AllowSizing = .f.
	var_Column.Width = 32
	var_Column.HTMLCaption = "<img>1</img>"
	var_Column.HeaderAlignment = 1
	var_Column.Alignment = 1
	' var_Column.Def(17) = 1
	oG2antt.TemplateDef = "dim var_Column"
	oG2antt.TemplateDef = var_Column
	oG2antt.Template = "var_Column.Def(17) = 1"

oG2antt.Columns.Add("Rest")
var_Items = oG2antt.Items
	var_Items.AddItem("<img>1</img>")
	var_Items.AddItem("<img>2</img>")
	var_Items.AddItem("<img>3</img>")
oG2antt.EndUpdate()
|
|
1552
|
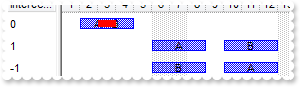
Is there any way to determine in a bar would overlay another bar or to not allow this and get some error indication
' Occurs when a bar is moved or resized.
function BarResize as v (Item  as  OLE::Exontrol.G2antt.1::HITEM, Key  as  A)
	oG2antt = topparent:CONTROL_ACTIVEX1.activex
	oG2antt.Refresh()
end function

Dim h as N
Dim oG2antt as P
Dim var_Bar as P
Dim var_Bar1 as P
Dim var_Chart as P
Dim var_Items as P

oG2antt = topparent:CONTROL_ACTIVEX1.activex
oG2antt.BeginUpdate()
oG2antt.DefaultItemHeight = 22
oG2antt.Columns.Add("InterectBars")
var_Chart = oG2antt.Chart
	' var_Chart.PaneWidth(.f.) = 48
	oG2antt.TemplateDef = "dim var_Chart"
	oG2antt.TemplateDef = var_Chart
	oG2antt.Template = "var_Chart.PaneWidth(False) = 48"

	var_Chart.FirstVisibleDate = {01/01/2001}
	var_Bar = var_Chart.Bars.Item("Task")
		var_Bar.OverlaidType = 2
		' var_Bar.Overlaid(2) = "ERROR"
		oG2antt.TemplateDef = "dim var_Bar"
		oG2antt.TemplateDef = var_Bar
		oG2antt.Template = "var_Bar.Overlaid(2) = `ERROR`"

	var_Bar1 = var_Chart.Bars.Add("ERROR")
		var_Bar1.Color = 255
		var_Bar1.Pattern = 1
		var_Bar1.Height = 7
var_Items = oG2antt.Items
	h = var_Items.AddItem("")
	var_Items.AddBar(h,"Task",{01/02/2001},{01/04/2001},"A","A")
	var_Items.AddBar(h,"Task",{01/03/2001},{01/05/2001},"B","B")
	' var_Items.CellValue(h,0) = var_Items.IntersectBars(h,"A",h,"B")
	oG2antt.TemplateDef = "dim var_Items,h"
	oG2antt.TemplateDef = var_Items
	oG2antt.TemplateDef = h
	oG2antt.Template = "var_Items.CellValue(h,0) = IntersectBars(h,`A`,h,`B`)"

	h = var_Items.AddItem("")
	var_Items.AddBar(h,"Task",{01/06/2001},{01/09/2001},"A","A")
	var_Items.AddBar(h,"Task",{01/10/2001},{01/13/2001},"B","B")
	' var_Items.CellValue(h,0) = var_Items.IntersectBars(h,"A",h,"B")
	oG2antt.TemplateDef = "dim var_Items,h"
	oG2antt.TemplateDef = var_Items
	oG2antt.TemplateDef = h
	oG2antt.Template = "var_Items.CellValue(h,0) = IntersectBars(h,`A`,h,`B`)"

	h = var_Items.AddItem("")
	var_Items.AddBar(h,"Task",{01/06/2001},{01/09/2001},"B","B")
	var_Items.AddBar(h,"Task",{01/10/2001},{01/13/2001},"A","A")
	' var_Items.CellValue(h,0) = var_Items.IntersectBars(h,"A",h,"B")
	oG2antt.TemplateDef = "dim var_Items,h"
	oG2antt.TemplateDef = var_Items
	oG2antt.TemplateDef = h
	oG2antt.Template = "var_Items.CellValue(h,0) = IntersectBars(h,`A`,h,`B`)"

oG2antt.EndUpdate()
|
|
1551
|
Is it possible to change the font size of the header compared to that of the control. I would like to make the font of the headers smaller
Dim oG2antt as P
Dim var_Chart as local
Dim var_Column as P
Dim var_Column1 as local
Dim var_Columns as P
Dim var_Items as P

oG2antt = topparent:CONTROL_ACTIVEX1.activex
oG2antt.BeginUpdate()
oG2antt.HeaderHeight = 32
var_Columns = oG2antt.Columns
	var_Column = var_Columns.Add("ID")
		var_Column.HTMLCaption = "<font ;16>ID"
		var_Column.Width = 32
		var_Column.AllowSizing = .f.
	' var_Columns.Add("Task").HTMLCaption = "<font ;16>Task"
	var_Column1 = var_Columns.Add("Task")
	oG2antt.TemplateDef = "dim var_Column1"
	oG2antt.TemplateDef = var_Column1
	oG2antt.Template = "var_Column1.HTMLCaption = `<font ;16>Task`"

oG2antt.FocusColumnIndex = 1
oG2antt.ShowFocusRect = .f.
' oG2antt.Chart.PaneWidth(.t.) = 0
var_Chart = oG2antt.Chart
oG2antt.TemplateDef = "dim var_Chart"
oG2antt.TemplateDef = var_Chart
oG2antt.Template = "var_Chart.PaneWidth(True) = 0"

var_Items = oG2antt.Items
	' var_Items.CellValue(var_Items.AddItem(1),1) = "Task A"
	oG2antt.TemplateDef = "dim var_Items"
	oG2antt.TemplateDef = var_Items
	oG2antt.Template = "var_Items.CellValue(AddItem(1),1) = `Task A`"

	' var_Items.CellValue(var_Items.AddItem(2),1) = "Task B"
	oG2antt.TemplateDef = "dim var_Items"
	oG2antt.TemplateDef = var_Items
	oG2antt.Template = "var_Items.CellValue(AddItem(2),1) = `Task B`"

oG2antt.EndUpdate()
|
|
1550
|
How can I create items and bars at runtime
Dim oG2antt as P
Dim var_Chart as P
Dim var_Column as P
Dim var_Columns as P
Dim var_Editor as local

oG2antt = topparent:CONTROL_ACTIVEX1.activex
oG2antt.BeginUpdate()
var_Columns = oG2antt.Columns
	var_Column = var_Columns.Add("ID")
		var_Column.FormatColumn = "1 index ''"
		var_Column.Width = 32
		var_Column.AllowSizing = .f.
	' var_Columns.Add("Task").Editor.EditType = 1
	var_Editor = var_Columns.Add("Task").Editor
	oG2antt.TemplateDef = "dim var_Editor"
	oG2antt.TemplateDef = var_Editor
	oG2antt.Template = "var_Editor.EditType = 1"

oG2antt.FocusColumnIndex = 1
oG2antt.ShowFocusRect = .f.
var_Chart = oG2antt.Chart
	' var_Chart.PaneWidth(.f.) = 128
	oG2antt.TemplateDef = "dim var_Chart"
	oG2antt.TemplateDef = var_Chart
	oG2antt.Template = "var_Chart.PaneWidth(False) = 128"

	var_Chart.FirstVisibleDate = {01/01/2001}
	var_Chart.AllowCreateBar = 1
oG2antt.Template = "Chart.Bars(\"Task\"){Def(3) = \"<%=%C1%>\";Def(4)=18}"
oG2antt.EndUpdate()
|
|
1549
|
How can I a group summary bar with a task bar, so when the summary bar changes the task bar will move accordingly
Dim hSummary as N
Dim hTask as N
Dim oG2antt as P
Dim var_Chart as P
Dim var_Items as P

oG2antt = topparent:CONTROL_ACTIVEX1.activex
oG2antt.Columns.Add("Task")
var_Chart = oG2antt.Chart
	' var_Chart.PaneWidth(.f.) = 128
	oG2antt.TemplateDef = "dim var_Chart"
	oG2antt.TemplateDef = var_Chart
	oG2antt.Template = "var_Chart.PaneWidth(False) = 128"

	var_Chart.FirstVisibleDate = {01/01/2001}
var_Items = oG2antt.Items
	hSummary = var_Items.AddItem("Summary")
	var_Items.AddBar(hSummary,"Summary",{01/02/2001},{01/02/2001})
	hTask = var_Items.AddItem("Task A")
	var_Items.AddBar(hTask,"Task",{01/02/2001},{01/05/2001})
	var_Items.DefineSummaryBars(hSummary,"",hTask,"")
	hTask = var_Items.AddItem("Task B")
	var_Items.AddBar(hTask,"Task",{01/04/2001},{01/08/2001})
	var_Items.DefineSummaryBars(hSummary,"",hTask,"")
|
|
1548
|
How can I show the bars using a solid color, with no pattern inside
Dim h as N
Dim oG2antt as P
Dim var_Chart as P
Dim var_Items as P

oG2antt = topparent:CONTROL_ACTIVEX1.activex
oG2antt.BeginUpdate()
oG2antt.DefaultItemHeight = 24
oG2antt.DrawGridLines = -1
var_Chart = oG2antt.Chart
	var_Chart.DrawGridLines = -1
	var_Chart.NonworkingDays = 0
	' var_Chart.PaneWidth(.f.) = 128
	oG2antt.TemplateDef = "dim var_Chart"
	oG2antt.TemplateDef = var_Chart
	oG2antt.Template = "var_Chart.PaneWidth(False) = 128"

	var_Chart.FirstVisibleDate = {01/01/2001}
	var_Chart.Bars.Item("Task").Pattern = 1
oG2antt.Columns.Add("Column")
var_Items = oG2antt.Items
	h = var_Items.AddItem("Solid A")
	var_Items.AddBar(h,"Task",{01/02/2001},{01/04/2001},"A")
	var_Items.AddBar(h,"Task",{01/05/2001},{01/07/2001},"B")
	' var_Items.ItemBar(h,"B",33) = 255
	oG2antt.TemplateDef = "dim var_Items,h"
	oG2antt.TemplateDef = var_Items
	oG2antt.TemplateDef = h
	oG2antt.Template = "var_Items.ItemBar(h,`B`,33) = 255"

	var_Items.AddBar(h,"Task",{01/08/2001},{01/10/2001},"C")
	' var_Items.ItemBar(h,"C",33) = 65280
	oG2antt.TemplateDef = "dim var_Items,h"
	oG2antt.TemplateDef = var_Items
	oG2antt.TemplateDef = h
	oG2antt.Template = "var_Items.ItemBar(h,`C`,33) = 65280"

	h = var_Items.AddItem("Solid B")
	var_Items.AddBar(h,"Task",{01/02/2001},{01/04/2001},"A")
	' var_Items.ItemBar(h,"A",7) = 255
	oG2antt.TemplateDef = "dim var_Items,h"
	oG2antt.TemplateDef = var_Items
	oG2antt.TemplateDef = h
	oG2antt.Template = "var_Items.ItemBar(h,`A`,7) = 255"

	var_Items.AddBar(h,"Task",{01/05/2001},{01/07/2001},"B")
	' var_Items.ItemBar(h,"B",33) = 255
	oG2antt.TemplateDef = "dim var_Items,h"
	oG2antt.TemplateDef = var_Items
	oG2antt.TemplateDef = h
	oG2antt.Template = "var_Items.ItemBar(h,`B`,33) = 255"

	' var_Items.ItemBar(h,"B",7) = 65280
	oG2antt.TemplateDef = "dim var_Items,h"
	oG2antt.TemplateDef = var_Items
	oG2antt.TemplateDef = h
	oG2antt.Template = "var_Items.ItemBar(h,`B`,7) = 65280"

	var_Items.AddBar(h,"Task",{01/08/2001},{01/10/2001},"C")
	' var_Items.ItemBar(h,"C",33) = 16711680
	oG2antt.TemplateDef = "dim var_Items,h"
	oG2antt.TemplateDef = var_Items
	oG2antt.TemplateDef = h
	oG2antt.Template = "var_Items.ItemBar(h,`C`,33) = 16711680"

	' var_Items.ItemBar(h,"C",7) = 16711935
	oG2antt.TemplateDef = "dim var_Items,h"
	oG2antt.TemplateDef = var_Items
	oG2antt.TemplateDef = h
	oG2antt.Template = "var_Items.ItemBar(h,`C`,7) = 16711935"

oG2antt.EndUpdate()
|
|
1547
|
Basically what I am trying to do is replicate MS Project look & feel. Is that possible
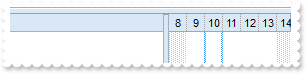
Dim oG2antt as P
Dim var_Appearance as P
Dim var_Chart as P

oG2antt = topparent:CONTROL_ACTIVEX1.activex
oG2antt.BeginUpdate()
var_Appearance = oG2antt.VisualAppearance
	var_Appearance.Add(1,"gBFLBCJwBAEHhEJAEGg4BNUMQAAYAQGKIYBkAKBQAGaAoDDMOQ4QwAAxDCKsEwsACEIrjKCRShyCYZRhGcTALD8EhhECTZKkAYQEiKLoaRzAcwyDAcQRFCKUJxhEYZai+NobSBQMZqBQgASIUCLZ5ACSYEigAovTULCKwJiWNZDUTRcTxCKQahLLivIhGUYKfgmY5lT5VUT1HS9IShJSmKTlORLOi+M4zUJLc4SVblGz7FyfYDBKygLqqFigLAxdDYTRNfzjHiTKbtGA7MADA4DVTAeC2bC+EYVTytY4sHQrIACZ5iWREMhXTi0E4rTa6dTxaS6KzKGqsZbsNAbHLdHTfVy1Mx1XaobqDJZdaTpdjaTDeJSjVjKdx4TZqSizjSGJOgcU4RhcIQDDURhIESXwEGgbQJBQQjeggQBiC4NJAluGJrAUB5Lmmc56n4Pp/i+NQjmqdQ5k2J5+AGAAgCgFgEgAHxQAGfoBmAOA2AaAxghgLgOgMIJ4AoER8mEWBSBoNohHKAgZgSYgIHYH4ImCB5OAqBghjiEgcgmIQoioD4IiKGJGCsUgUHiVirmOBQVAEgI=")
	var_Appearance.Add(39,"CP:1 -1 -1 0 0")
	var_Appearance.Add(40,"gBFLBCJwBAEHhEJAEGg4BEcMQAAYAQGKIYBkAKBQAGaAoDDMOQ4QwAAxDCKsEwsACEIrjKCRShyCYZRhGcTAFD8EhhECTZKkAZwEiKLoaRzAcwyDAcQRFCKUJxlKa5PjaLwAAbJMZKAqDDgBIijIqnKA5JoyKIkTzCIJxXScByDGqNaQoehYXhEMg1CTXVgRCKoYTDBKybLqGT6VoCP5vWJaURWHZFTTJOyNagmSJ6XACbQMW7gNYQGBEEigNIxToOU4jFDGIB2VAQRK5BDQbQSFCpIRCCRQYhcQJ6YIAD76HomS5NU7UNKhHSdMy3J6ra5sOqbBqWa5LWjbNq3DadSzvPKub5vexwHwWawSUDkOR5Li+M43S4JPS5bZdDxPiWVJrnWOw9F6XxTiGWpsHcO5+C6Xx7kOZpwHoOxeF8T4fkeYJgnEdZwOwQRBnSex9H6f4vk+c5xn4fZQhQBCAg==")
	var_Appearance.Add(41,"gBFLBCJwBAEHhEJAEGg4BQICg6AADACAxRDAMkOQAGaAoDDUMQyQwAAxDSK8EwsACEIrjKCRShyCYZRhGcTALBMIwKGABIRGUZJGDkOYgDCBEhTHDUOwHGyQYDkCQoRiYMAwTBQMaTXDdCQ1ECkJomObqAgkMZCTbKMySAA0NgPD6sKSjOIRSDUJZcV5EoAKfiqZIRSJSMZVLLVNSVJipAAlOTZPo6JJuTLOE4WVRcSydH6oAApeg6KoYAFzQAEDCbYgOTKBYLUOCwTZmDwTK6BcTtXDbejeYYcZ7DNj2NYtJ4TRCBcpzLLIXrCKg0TBPQ4YNC2DT5VDWIq1aDdQo7MpxWjlGI5Ri2c51UDSYi0G4tDyLSYWXDfFSQTrHDQXhAAghCUAxJgyaB1DkGRyDCKBhAiGwLg0DYhCKDI8CcVwIAwRotBeAYCCmBZ0nsfR+n+L5PlYE53BwTpzn4AIAiAGAOAMfZfmeVBwDuD54C4DYDCCaA6AgQJfHGPJtD+YRoGIF4GGGrAAH2RpjjCf4IGIOIKCSCQhmeXBtDqT54i4LYLCKaI6CkfRGlOKgtg2IxYl4OoMkwIYwmkP5jmkAg/hAZAYnAaw6A+eQeEmEgkikKg8BqDkYFCFIlBkThTg8BoThif4WGWORqFyFwjkGIJlD+ZgphIY4ZGYWYEmSGQmjGIhthvMpwGcOJPnmTh1h0JxploPAZg4I5+HyH4nlmfh/g8BhTgSf4hGgegagiIlShCYA/miahCg+JBpUIYw3k+ehehmJgpioaoWDeKYagAY4oioSZFn2BQfFGCJdD+aoqjKK4rGqWJwGENwPnqTo1i1gtiBgDYzn6PIviuWp+j+DwFnMaJ/jEbB7BqSIyCOQR4lkP5smsQpPjQbQbDSWI0C0cR6lmNpqGMCgJDCBZTFyf44G4O4KmSOWTnCVg/m6K4ymuOxu4OWw1E+e5OnWPQvGvYgWg0Q5+nyP4vlvE+OBMTJ/kEcB8BsCJCDATArA6QhxAgeIgkScRMFcFpFlCFAEICA")
	var_Appearance.Add(42,"gBFLBCJwBAEHhEJAEGg4BY8MQAAYAQGKIYBkAKBQAGaAoDDMOQ4QwAAwjQLMEwsACEIrjKCRShyCYZRhGcTALD8EhhECTZKkAYgEiKLoaRzAcwyDAcQRFCKUJxhEY5ai+NobRCAUiwHQUBr/I4AKLfeJ5dACKYNShRMrSABMNgZBKpJAqKiqJoiFoRDINIi2BYUIhqGCxYRseyZegmEYWVTREr3HKsVTtAanjZSJakXxnGaQJ7jKaLXo6II8YTIWBABaIAQiBahQArOiKchaTZ5YheFRYVBOG4bK6BcguW4qGxSXpuRxZOo2YAFVzNNC3YzkCIcegnIp9ZxeFK5Tg1Z4XKTaNwqPBcYpHPqdVhCOgYZwUb5XMjWNatLYIboziiUhzCAeJeG6ZAAAiBIUA0JgziGVJkGUGJIBgUYSBEN5VBoGxCEUHItjSFAxBcRhim4dIqFGTB+BUfxfneegAgCYAoBQFR+lQeASAEBRIGESAogMYJ4DoEIEmCaAqAoJoGGCbgYgaIYYG4HoHGICByCKAoKmGZBOgkYh4hoKIKmKKI2CmC5giMBINBgY0AjODRjgiXg6g2I8glUKAHEifhBhAJApBYRIRmQOQmAoOgLBIEhMhOJJZD4UoUGUSRCFaAoOHKPIAhYZY5GoXIXmWaYGF2GJlgKMB9DmZhpiIZ4aGaSYuG6GomigWgGDmCohmYdIdicWZeHqHRnCgHgIh8aAIBoCA/lAECAg")
oG2antt.Appearance = 671088640 '28000000 +
oG2antt.BackColor = 16777215
oG2antt.BackColorLevelHeader = 16777215
oG2antt.BackColorHeader = 654311424
oG2antt.SelBackColor = 0
oG2antt.SelForeColor = 16777215
var_Chart = oG2antt.Chart
	var_Chart.BackColorLevelHeader = 654311424
	var_Chart.BackColor = 16777215
	var_Chart.Bars.Item("Task").Color = 704643072
oG2antt.FilterBarBackColor = 16777216
oG2antt.Template = "Background(32) = 687865856" // oG2antt.Background(32) = 687865856
oG2antt.Template = "Background(64) = 16777216" // oG2antt.Background(64) = 16777216
oG2antt.Template = "Background(18) = 16777216" // oG2antt.Background(18) = 16777216
oG2antt.EndUpdate()
|
|
1546
|
Is there anyway to change the style of the splitter which separates the list/chart
Dim oG2antt as P

oG2antt = topparent:CONTROL_ACTIVEX1.activex
oG2antt.VisualAppearance.Add(1,"c:\exontrol\images\normal.ebn")
oG2antt.Template = "Background(0) = 16777216" // oG2antt.Background(0) = 16777216
oG2antt.Template = "Background(18) = 33488896" // oG2antt.Background(18) = 33488896
|
|
1545
|
Does your control support subscript or superscript, in HTML captions
Dim h as N
Dim oG2antt as P
Dim var_Chart as P
Dim var_Items as P

oG2antt = topparent:CONTROL_ACTIVEX1.activex
var_Chart = oG2antt.Chart
	var_Chart.FirstVisibleDate = {01/01/2001}
	' var_Chart.PaneWidth(.f.) = 64
	oG2antt.TemplateDef = "dim var_Chart"
	oG2antt.TemplateDef = var_Chart
	oG2antt.Template = "var_Chart.PaneWidth(False) = 64"

oG2antt.Columns.Add("Column")
var_Items = oG2antt.Items
	h = var_Items.AddItem("Item 1")
	var_Items.AddBar(h,"Task",{01/02/2001},{01/04/2001},"")
	' var_Items.ItemBar(h,"",3) = "<sha ;;0>Event <b><font ;6><off -6>2<off 4>3<off 4>1"
	oG2antt.TemplateDef = "dim var_Items,h"
	oG2antt.TemplateDef = var_Items
	oG2antt.TemplateDef = h
	oG2antt.Template = "var_Items.ItemBar(h,``,3) = `<sha ;;0>Event <b><font ;6><off -6>2<off 4>3<off 4>1`"

	' var_Items.ItemBar(h,"",4) = 18
	oG2antt.TemplateDef = "dim var_Items,h"
	oG2antt.TemplateDef = var_Items
	oG2antt.TemplateDef = h
	oG2antt.Template = "var_Items.ItemBar(h,``,4) = 18"
|
|
1544
|
I have noticed that the column's header is changed once the cursor hovers it. Is it possible to change that visual appearance
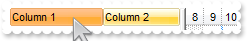
Dim oG2antt as P
Dim var_Columns as P

oG2antt = topparent:CONTROL_ACTIVEX1.activex
oG2antt.VisualAppearance.Add(1,"c:\exontrol\images\normal.ebn")
var_Columns = oG2antt.Columns
	var_Columns.Add("Column 1")
	var_Columns.Add("Column 2")
oG2antt.BackColorHeader = 16777216
oG2antt.Template = "Background(32) = 19760895" // oG2antt.Background(32) = 19760895
|
|
1543
|
Is it possible to change the visual appearance of the columns selector/floating bar(3)
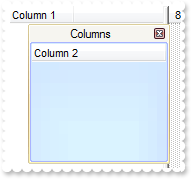
Dim oG2antt as P
Dim var_Column as local
Dim var_Columns as P

oG2antt = topparent:CONTROL_ACTIVEX1.activex
oG2antt.ColumnAutoResize = .f.
var_Columns = oG2antt.Columns
	var_Columns.Add("Column 1")
	' var_Columns.Add("Column 2").Visible = .f.
	var_Column = var_Columns.Add("Column 2")
	oG2antt.TemplateDef = "dim var_Column"
	oG2antt.TemplateDef = var_Column
	oG2antt.Template = "var_Column.Visible = False"

oG2antt.VisualAppearance.Add(2,"c:\exontrol\images\normal.ebn")
oG2antt.VisualAppearance.Add(3,"c:\exontrol\images\pushed.ebn")
oG2antt.Template = "Background(92) = 33554432" // oG2antt.Background(92) = 33554432
oG2antt.Template = "Background(87) = 50331648" // oG2antt.Background(87) = 50331648
oG2antt.Template = "Background(93) = 15791606" // oG2antt.Background(93) = 15791606
oG2antt.ColumnsFloatBarVisible = .t.
|
|
1542
|
Is it possible to change the visual appearance of the columns selector/floating bar(2)
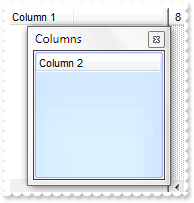
Dim oG2antt as P
Dim var_Column as local
Dim var_Columns as P

oG2antt = topparent:CONTROL_ACTIVEX1.activex
oG2antt.ColumnAutoResize = .f.
var_Columns = oG2antt.Columns
	var_Columns.Add("Column 1")
	' var_Columns.Add("Column 2").Visible = .f.
	var_Column = var_Columns.Add("Column 2")
	oG2antt.TemplateDef = "dim var_Column"
	oG2antt.TemplateDef = var_Column
	oG2antt.Template = "var_Column.Visible = False"

oG2antt.VisualAppearance.Add(3,"c:\exontrol\images\pushed.ebn")
oG2antt.Template = "Background(87) = 50331648" // oG2antt.Background(87) = 50331648
oG2antt.ColumnsFloatBarVisible = .t.
|
|
1541
|
Is it possible to change the visual appearance of the columns selector/floating bar(1)
Dim oG2antt as P

oG2antt = topparent:CONTROL_ACTIVEX1.activex
oG2antt.VisualAppearance.Add(2,"c:\exontrol\images\normal.ebn")
oG2antt.Template = "Background(92) = 33554432" // oG2antt.Background(92) = 33554432
oG2antt.Template = "Background(87) = 15791606" // oG2antt.Background(87) = 15791606
oG2antt.Template = "Background(93) = 15791606" // oG2antt.Background(93) = 15791606
oG2antt.ColumnsFloatBarVisible = .t.
|
|
1540
|
I am using the ColumnsFloatBarVisible property on True, but still not able to add any column on that list
Dim oG2antt as P
Dim var_Column as local
Dim var_Columns as P

oG2antt = topparent:CONTROL_ACTIVEX1.activex
oG2antt.ColumnAutoResize = .f.
var_Columns = oG2antt.Columns
	var_Columns.Add("Column 1")
	' var_Columns.Add("Column 2").Visible = .f.
	var_Column = var_Columns.Add("Column 2")
	oG2antt.TemplateDef = "dim var_Column"
	oG2antt.TemplateDef = var_Column
	oG2antt.Template = "var_Column.Visible = False"

oG2antt.ColumnsFloatBarVisible = .t.
|
|
1539
|
Is it possible to list a column to columns selector/floating bar, but still user can use it
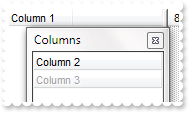
Dim oG2antt as P
Dim var_Column as local
Dim var_Column1 as P
Dim var_Columns as P

oG2antt = topparent:CONTROL_ACTIVEX1.activex
oG2antt.ColumnAutoResize = .f.
var_Columns = oG2antt.Columns
	var_Columns.Add("Column 1")
	' var_Columns.Add("Column 2").Visible = .f.
	var_Column = var_Columns.Add("Column 2")
	oG2antt.TemplateDef = "dim var_Column"
	oG2antt.TemplateDef = var_Column
	oG2antt.Template = "var_Column.Visible = False"

	var_Column1 = var_Columns.Add("Column 3")
		var_Column1.Visible = .f.
		var_Column1.Enabled = .f.
oG2antt.ColumnsFloatBarVisible = .t.
|
|
1538
|
How can I prevent a specific column not to be listed in the columns selector/floating bar
Dim oG2antt as P
Dim var_Column as local
Dim var_Column1 as P
Dim var_Columns as P

oG2antt = topparent:CONTROL_ACTIVEX1.activex
oG2antt.ColumnAutoResize = .f.
var_Columns = oG2antt.Columns
	var_Columns.Add("Column 1")
	' var_Columns.Add("Column 2").Visible = .f.
	var_Column = var_Columns.Add("Column 2")
	oG2antt.TemplateDef = "dim var_Column"
	oG2antt.TemplateDef = var_Column
	oG2antt.Template = "var_Column.Visible = False"

	var_Column1 = var_Columns.Add("Column 3")
		var_Column1.Visible = .f.
		var_Column1.AllowDragging = .f.
oG2antt.ColumnsFloatBarVisible = .t.
|
|
1537
|
Is it possible to change the "Columns" caption being shown in the columns selector/floating bar
Dim oG2antt as P
Dim var_Column as local
Dim var_Columns as P

oG2antt = topparent:CONTROL_ACTIVEX1.activex
oG2antt.ColumnAutoResize = .f.
var_Columns = oG2antt.Columns
	var_Columns.Add("Column 1")
	' var_Columns.Add("Column 2").Visible = .f.
	var_Column = var_Columns.Add("Column 2")
	oG2antt.TemplateDef = "dim var_Column"
	oG2antt.TemplateDef = var_Column
	oG2antt.Template = "var_Column.Visible = False"

oG2antt.Template = "Description(26) = `Hidden Columns`" // oG2antt.Description(26) = "Hidden Columns"
oG2antt.ColumnsFloatBarVisible = .t.
|
|
1536
|
How can I show the columns selector, so the user can drag and drop columns to the view
Dim oG2antt as P
Dim var_Column as local
Dim var_Columns as P

oG2antt = topparent:CONTROL_ACTIVEX1.activex
oG2antt.ColumnAutoResize = .f.
var_Columns = oG2antt.Columns
	var_Columns.Add("Column 1")
	' var_Columns.Add("Column 2").Visible = .f.
	var_Column = var_Columns.Add("Column 2")
	oG2antt.TemplateDef = "dim var_Column"
	oG2antt.TemplateDef = var_Column
	oG2antt.Template = "var_Column.Visible = False"

oG2antt.ColumnsFloatBarVisible = .t.
|
|
1535
|
The column's header is changed while the cursor hovers it. Is it possible to prevent that
Dim oG2antt as P
Dim var_Columns as P

oG2antt = topparent:CONTROL_ACTIVEX1.activex
var_Columns = oG2antt.Columns
	var_Columns.Add("Column 1")
	var_Columns.Add("Column 2")
oG2antt.Template = "Background(32) = -1" // oG2antt.Background(32) = -1
|
|
1534
|
Is there any property I can save and restore automatically the current setting, column position, size, and so on (2)
Dim oG2antt as P
Dim var_Items as P

oG2antt = topparent:CONTROL_ACTIVEX1.activex
oG2antt.BeginUpdate()
oG2antt.Columns.Add("Column")
var_Items = oG2antt.Items
	var_Items.AddItem("Item 1")
	var_Items.AddItem("Item 2")
	var_Items.AddItem("Item 3")
oG2antt.Layout = "Select=\"0\";SingleSort=\"C0:2\";Columns=1"
oG2antt.EndUpdate()
|
|
1533
|
Is there any property I can save and restore automatically the current setting, column position, size, and so on (1)
Dim oG2antt as P
Dim var_Items as P

oG2antt = topparent:CONTROL_ACTIVEX1.activex
oG2antt.BeginUpdate()
oG2antt.Columns.Add("Column")
var_Items = oG2antt.Items
	var_Items.AddItem("Item 1")
	var_Items.AddItem("Item 2")
	var_Items.AddItem("Item 3")
oG2antt.Layout = "gBjAAwAAuABmABpABsAB0ABlAByhoAPIAOEPAA9gYABoABQAgUEg0XN4AOcJicKkpujMbjsfkMFk0YhkQgUOjUEl8gjcGO0ok8KMULjEaGMcj08kQAO8oMkTNEtGwAGQAqc7gUlhh1ABtAEsk9GpEfhElgVcsMupNlnlonlaAFcr0shUsp8QPEtnVJqJhmcIhUMh0QiU5sYAqMngUSuEMw07k8Qv0SgVRrNEuVflF2jF5x9JyNEm0TjQijemyE0jE3t+YruauoAu4Az1qj9BzRn0UzksSnAA0xDjY6qnAw8OiUQ0dwzN0zWz2t7j8/xURAGNvWH6k8xlEhklhEI0O/6QAgI="
oG2antt.EndUpdate()
|
|
1532
|
How do I arrange my columns on multiple levels
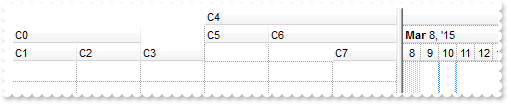
Dim oG2antt as P
Dim var_Column as P
Dim var_Column1 as P
Dim var_Column2 as P
Dim var_Columns as P

oG2antt = topparent:CONTROL_ACTIVEX1.activex
oG2antt.BeginUpdate()
oG2antt.ColumnAutoResize = .f.
oG2antt.DrawGridLines = -1
var_Columns = oG2antt.Columns
	var_Column = var_Columns.Add("C0")
		var_Column.ExpandColumns = "1,2"
		var_Column.DisplayExpandButton = .f.
	var_Columns.Add("C1")
	var_Columns.Add("C2")
	var_Columns.Add("C3")
	var_Column1 = var_Columns.Add("C4")
		var_Column1.ExpandColumns = "5,6"
		var_Column1.DisplayExpandButton = .f.
	var_Columns.Add("C5")
	var_Column2 = var_Columns.Add("C6")
		var_Column2.ExpandColumns = "6,7"
		var_Column2.DisplayExpandButton = .f.
	var_Columns.Add("C7")
oG2antt.EndUpdate()
|
|
1531
|
Does your control support expandable header or columns, so I can arrange it on multiple levels
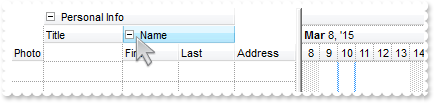
Dim oG2antt as P
Dim var_Column as P
Dim var_Column1 as local
Dim var_Column2 as P
Dim var_Columns as P

oG2antt = topparent:CONTROL_ACTIVEX1.activex
oG2antt.BeginUpdate()
oG2antt.DrawGridLines = -1
oG2antt.BackColorLevelHeader = 15790320
var_Columns = oG2antt.Columns
	var_Column = var_Columns.Add("Photo")
		var_Column.AllowSizing = .f.
		var_Column.Width = 32
	var_Columns.Add("Personal Info")
	var_Columns.Add("Title")
	var_Columns.Add("Name")
	var_Columns.Add("First")
	var_Columns.Add("Last")
	var_Columns.Add("Address")
	' var_Columns.Item("Personal Info").ExpandColumns = "2,3"
	var_Column1 = var_Columns.Item("Personal Info")
	oG2antt.TemplateDef = "dim var_Column1"
	oG2antt.TemplateDef = var_Column1
	oG2antt.Template = "var_Column1.ExpandColumns = `2,3`"

	var_Column2 = var_Columns.Item("Name")
		var_Column2.ExpandColumns = "4,5"
		var_Column2.Expanded = .f.
oG2antt.EndUpdate()
|
|
1530
|
I need a Day/Hour Display where the Bars should be created/resized in a 15 Minute Scale in a normal View, but in a 5 Minute Scale when on an InsideZoom. How can I do that
Dim oG2antt as P
Dim var_Chart as P
Dim var_InsideZoomFormat as P
Dim var_Items as P
Dim var_Level as local
Dim var_Level1 as local
Dim var_Level2 as local
Dim var_Level3 as local

oG2antt = topparent:CONTROL_ACTIVEX1.activex
oG2antt.BeginUpdate()
oG2antt.Columns.Add("Task")
var_Chart = oG2antt.Chart
	' var_Chart.PaneWidth(.f.) = 128
	oG2antt.TemplateDef = "dim var_Chart"
	oG2antt.TemplateDef = var_Chart
	oG2antt.Template = "var_Chart.PaneWidth(False) = 128"

	var_Chart.AllowCreateBar = 1
	var_Chart.UnitWidth = 50
	var_Chart.FirstVisibleDate = {01/01/2013}
	var_Chart.LevelCount = 2
	' var_Chart.Level(0).Label = 4096
	var_Level = var_Chart.Level(0)
	oG2antt.TemplateDef = "dim var_Level"
	oG2antt.TemplateDef = var_Level
	oG2antt.Template = "var_Level.Label = 4096"

	' var_Chart.Level(1).Label = "<%h%>:<%nn%>"
	var_Level1 = var_Chart.Level(1)
	oG2antt.TemplateDef = "dim var_Level1"
	oG2antt.TemplateDef = var_Level1
	oG2antt.Template = "var_Level1.Label = `<%h%>:<%nn%>`"

	' var_Chart.Level(1).Unit = 1048576
	var_Level2 = var_Chart.Level(1)
	oG2antt.TemplateDef = "dim var_Level2"
	oG2antt.TemplateDef = var_Level2
	oG2antt.Template = "var_Level2.Unit = 1048576"

	' var_Chart.Level(1).Count = 60
	var_Level3 = var_Chart.Level(1)
	oG2antt.TemplateDef = "dim var_Level3"
	oG2antt.TemplateDef = var_Level3
	oG2antt.Template = "var_Level3.Count = 60"

	var_Chart.ResizeUnitScale = 1048576
	var_Chart.ResizeUnitCount = 15
	var_Chart.AllowInsideZoom = .t.
	var_InsideZoomFormat = var_Chart.DefaultInsideZoomFormat
		var_InsideZoomFormat.InsideCount = 5
		var_InsideZoomFormat.InsideUnit = 1048576
		var_InsideZoomFormat.InsideLabel = "<%nn%>"
var_Items = oG2antt.Items
	var_Items.AddItem("Item")
oG2antt.EndUpdate()
|
|
1529
|
Can I change the format of date to be shown in the control
Dim oG2antt as P
Dim var_Chart as local
Dim var_Column as P
Dim var_Column1 as P
Dim var_Column2 as P
Dim var_Columns as P
Dim var_Items as P

oG2antt = topparent:CONTROL_ACTIVEX1.activex
' oG2antt.Chart.PaneWidth(.t.) = 0
var_Chart = oG2antt.Chart
oG2antt.TemplateDef = "dim var_Chart"
oG2antt.TemplateDef = var_Chart
oG2antt.Template = "var_Chart.PaneWidth(True) = 0"

var_Columns = oG2antt.Columns
	var_Columns.Add("Default")
	var_Column = var_Columns.Add("Format.1")
		var_Column.ComputedField = "%0"
		var_Column.FormatColumn = "dateF(value) replace `/` with `-`"
	var_Column1 = var_Columns.Add("Format.2")
		var_Column1.ComputedField = "%0"
		' var_Column1.Def(17) = 1
		oG2antt.TemplateDef = "dim var_Column1"
		oG2antt.TemplateDef = var_Column1
		oG2antt.Template = "var_Column1.Def(17) = 1"

		var_Column1.FormatColumn = "`<b>`+ shortdate(value) + `</b> ` + timeF(value)"
	var_Column2 = var_Columns.Add("Format.3")
		var_Column2.ComputedField = "%0"
		' var_Column2.Def(17) = 1
		oG2antt.TemplateDef = "dim var_Column2"
		oG2antt.TemplateDef = var_Column2
		oG2antt.Template = "var_Column2.Def(17) = 1"

		var_Column2.FormatColumn = "` <b>`+ ( weekday(value) case ( 0 : `Su`; 1 : `Mo`; 2 : `Tu`; 3 : `We`; 4 : `Th`; 5 : `Fr`; 6 : `Sa`) ) + `</b> ` + ( dateF(value) replace `/` with `-` )"
var_Items = oG2antt.Items
	var_Items.AddItem({01/01/2001 10:00:00})
	var_Items.AddItem({01/02/2001 10:00:00})
|
|
1528
|
How can I display a text/caption on the chart part of the control
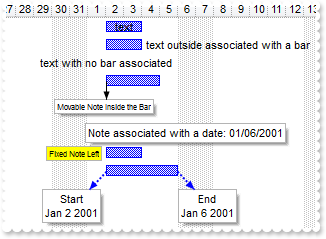
Dim h1 as N
Dim oG2antt as P
Dim var_Chart as P
Dim var_Items as P
Dim var_Note as local
Dim var_Note1 as P
Dim var_Note2 as P
Dim var_Note3 as P
Dim var_Notes as P

oG2antt = topparent:CONTROL_ACTIVEX1.activex
oG2antt.BeginUpdate()
oG2antt.AntiAliasing = .t.
var_Chart = oG2antt.Chart
	var_Chart.FirstVisibleDate = {12/26/2000}
	' var_Chart.PaneWidth(.f.) = 128
	oG2antt.TemplateDef = "dim var_Chart"
	oG2antt.TemplateDef = var_Chart
	oG2antt.Template = "var_Chart.PaneWidth(False) = 128"

oG2antt.Columns.Add("Column")
var_Items = oG2antt.Items
	h1 = var_Items.AddItem("Item 1")
	var_Items.AddBar(h1,"Task",{01/02/2001},{01/04/2001},"A")
	' var_Items.ItemBar(h1,"A",3) = "text"
	oG2antt.TemplateDef = "dim var_Items,h1"
	oG2antt.TemplateDef = var_Items
	oG2antt.TemplateDef = h1
	oG2antt.Template = "var_Items.ItemBar(h1,`A`,3) = `text`"

	h1 = var_Items.AddItem("Item 2")
	var_Items.AddBar(h1,"Task",{01/02/2001},{01/04/2001},"A")
	' var_Items.ItemBar(h1,"A",3) = "text outside associated with a bar"
	oG2antt.TemplateDef = "dim var_Items,h1"
	oG2antt.TemplateDef = var_Items
	oG2antt.TemplateDef = h1
	oG2antt.Template = "var_Items.ItemBar(h1,`A`,3) = `text outside associated with a bar`"

	' var_Items.ItemBar(h1,"A",4) = 18
	oG2antt.TemplateDef = "dim var_Items,h1"
	oG2antt.TemplateDef = var_Items
	oG2antt.TemplateDef = h1
	oG2antt.Template = "var_Items.ItemBar(h1,`A`,4) = 18"

	h1 = var_Items.AddItem("Item 3")
	var_Items.AddBar(h1,"",{01/02/2001},{01/02/2001},"A")
	' var_Items.ItemBar(h1,"A",3) = "text with no bar associated"
	oG2antt.TemplateDef = "dim var_Items,h1"
	oG2antt.TemplateDef = var_Items
	oG2antt.TemplateDef = h1
	oG2antt.Template = "var_Items.ItemBar(h1,`A`,3) = `text with no bar associated`"

	h1 = var_Items.AddItem("Item 4")
	var_Items.AddBar(h1,"Task",{01/02/2001},{01/05/2001},"A")
	h1 = var_Items.AddItem("Item 5")
	h1 = var_Items.AddItem("Item 6")
	h1 = var_Items.AddItem("Item 7")
	h1 = var_Items.AddItem("Item 8")
	var_Items.AddBar(h1,"Task",{01/02/2001},{01/04/2001},"A")
	h1 = var_Items.AddItem("Item 8")
	var_Items.AddBar(h1,"Task",{01/02/2001},{01/06/2001},"A")
var_Notes = oG2antt.Chart.Notes
	' var_Notes.Add("1S",oG2antt.Items.ItemByIndex(3),"A","<font ;6>Movable Note Inside the Bar").PartCanMove(0) = .t.
	var_Note = var_Notes.Add("1S",oG2antt.Items.ItemByIndex(3),"A","<font ;6>Movable Note Inside the Bar")
	oG2antt.TemplateDef = "dim var_Note"
	oG2antt.TemplateDef = var_Note
	oG2antt.Template = "var_Note.PartCanMove(0) = True"

	var_Notes.Add("AK",oG2antt.Items.ItemByIndex(6),{01/06/2001},"Note associated with a date: <%mm%>/<%dd%>/<%yyyy%>")
	var_Note1 = var_Notes.Add("2S",oG2antt.Items.ItemByIndex(7),"A","<font ;6>Fixed Note Left")
		var_Note1.ShowLink = 0
		' var_Note1.PartVOffset(1) = 0
		oG2antt.TemplateDef = "dim var_Note1"
		oG2antt.TemplateDef = var_Note1
		oG2antt.Template = "var_Note1.PartVOffset(1) = 0"

		' var_Note1.PartHOffset(0) = -32
		oG2antt.TemplateDef = "dim var_Note1"
		oG2antt.TemplateDef = var_Note1
		oG2antt.Template = "var_Note1.PartHOffset(0) = -32"

		' var_Note1.PartShadow(1) = .f.
		oG2antt.TemplateDef = "dim var_Note1"
		oG2antt.TemplateDef = var_Note1
		oG2antt.Template = "var_Note1.PartShadow(1) = False"

		' var_Note1.PartBackColor(1) = 65535
		oG2antt.TemplateDef = "dim var_Note1"
		oG2antt.TemplateDef = var_Note1
		oG2antt.Template = "var_Note1.PartBackColor(1) = 65535"

	var_Note2 = var_Notes.Add("3S",oG2antt.Items.ItemByIndex(8),"A","Start<br><%mmm%> <%d%> <%yyyy%>")
		' var_Note2.PartCanMove(1) = .t.
		oG2antt.TemplateDef = "dim var_Note2"
		oG2antt.TemplateDef = var_Note2
		oG2antt.Template = "var_Note2.PartCanMove(1) = True"

		' var_Note2.PartHOffset(1) = -64
		oG2antt.TemplateDef = "dim var_Note2"
		oG2antt.TemplateDef = var_Note2
		oG2antt.Template = "var_Note2.PartHOffset(1) = -64"

		var_Note2.LinkStyle = 2
		var_Note2.LinkWidth = 2
		var_Note2.LinkColor = 16711680
	var_Note3 = var_Notes.Add("3F",oG2antt.Items.ItemByIndex(8),"A","End<br><%mmm%> <%d%> <%yyyy%>")
		var_Note3.RelativePosition = 1
		' var_Note3.PartCanMove(1) = .t.
		oG2antt.TemplateDef = "dim var_Note3"
		oG2antt.TemplateDef = var_Note3
		oG2antt.Template = "var_Note3.PartCanMove(1) = True"

		var_Note3.LinkStyle = 2
		var_Note3.LinkWidth = 2
		var_Note3.LinkColor = 16711680
oG2antt.EndUpdate()
|
|
1527
|
Which is the best way of change Bar parent
Dim h1 as N
Dim h2 as N
Dim h3 as N
Dim oG2antt as P
Dim var_Items as P

oG2antt = topparent:CONTROL_ACTIVEX1.activex
oG2antt.Debug = .t.
oG2antt.Chart.FirstVisibleDate = {01/01/2001}
oG2antt.Columns.Add("Column")
var_Items = oG2antt.Items
	h1 = var_Items.AddItem("Item 1")
	var_Items.AddBar(h1,"Task",{01/02/2001},{01/04/2001},"A")
	h2 = var_Items.AddItem("Item 2")
	var_Items.AddBar(h2,"Task",{01/03/2001},{01/05/2001},"B")
	h3 = var_Items.AddItem("Item 3")
	var_Items.AddBar(h3,"Task",{01/05/2001},{01/07/2001},"A")
	' var_Items.ItemBar(h3,"A",512) = h1
	oG2antt.TemplateDef = "dim var_Items,h3"
	oG2antt.TemplateDef = var_Items
	oG2antt.TemplateDef = h3
	oG2antt.Template = "var_Items.ItemBar(h3,`A`,512) = h1"

	? "The Bar A of H3 fails to change the parent to H1 as it has already a bar named A"
	' var_Items.ItemBar(h3,"A",512) = h2
	oG2antt.TemplateDef = "dim var_Items,h3"
	oG2antt.TemplateDef = var_Items
	oG2antt.TemplateDef = h3
	oG2antt.Template = "var_Items.ItemBar(h3,`A`,512) = h2"

	? "The Bar A of H3 can be moved to H2, as it contains no bars with the key A"
|
|
1526
|
Is it possible to have a bar in bar
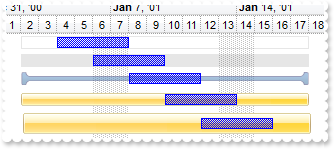
Dim h as N
Dim oG2antt as P
Dim var_Appearance as P
Dim var_Chart as P
Dim var_Items as P

oG2antt = topparent:CONTROL_ACTIVEX1.activex
oG2antt.BeginUpdate()
var_Appearance = oG2antt.VisualAppearance
	var_Appearance.Add(1,"gBFLBCJwBAEHhEJAEGg4BS4Dg6AADACAxRDAMgBQKAAzQFAYbBmGaGAAGIZhQgmFgAQhFcZQSKUOQTDKMIziYBYfgkMIgSbJUgDKAkRRdDSOYDmGQYDiCIoRShOMIjRLUXxtDYEIRkSZYJAKCTtBwJAAURRULR6ACUYDnSRqGj6CQKRqEVBSLAdKyXJKvaZhGIRSDUJZkWZEIyjBY8EzXNqrIDoGKqYgOQ4XV5TFgxPR9IyhEAaLrleT5TjOII/RpOEpYXSVHxFRAAAYhG4wABCXAAXjYF5Udhlfx3FCvMbqeCcSgOWoDZZRFa0PjVQQtNC4IitGzrMqrNaDSBlGigBauKw3TKlMzye7repOA5+aJGVz7VgfGz7EDjKg0GJcgMex3lOZB5jgPYHHMaYxjeRBilWbZNG4B49l2do6hkfIhECUhjDoHROEYUYMgEbQMCEEx+lGIY0CQUQJHYGoUgQGBFkgB4FmkOINiMbBrAwQoxngSQMCCYJAG8DYCkMZJNDOAhAHCbYGGGOBqByB5hiMcJSDORhwjQKoEkKSIgHoEZEDgWJOECSwyGSGwjkWUJUh8HADiiXA6CSRgQliFwcgcSICB2EJkCKDIAB4CAxDgMoOiOIkfA4CoiDCDhAmUEg4hEF4DHKCByA8JYpHIWwbAMIIuC6EIkCiOBwA2QpSHQbgOkoIZMD2GxmnmOhVhUJQiEwYAOAoQZQD6HhnjmaIfBuQ5BlQPQLiMEhuEKIRHmEKA7h+Q5ChQdQPmiahCg+JBnDAAhVCVPpoicHYEAobodicKZqHqGAO0YNA0ikQxKg6IYnAqAZcEGKxqnqOowiUZRSFwYwPAqIZkEOLhrjqaIqB4BAqn6QYwCwKwWkSMZECKLo6jKBA7DKTItWEZBlA8SpRmwRY1G0exYi0HoEEsbpdjcLZrgaYI4kQQo6laOYEFuIpojQCJiHAZgPksAZ0EePBvDuSp0j2bxrmadY+m8QpGnKP4EHwAwAjsCZxiQQQtAgAQrAiQowhKUB/BIcJsEMD5EHETBPBYEhLFwJwZBKMY8G6bAoEaIQMjcIIEkzUZJAscgEEuShyjyKwskucpskQSwuDITJQEyTYzGuMIjBsBBCmiBATjObQDD+UB0E0DxGlCNINASO5PnSMQ7E2Uxu3CbQRguUgYFCVR1H0WxYC2R5xDSDgVWiXA8AyNggksXwPDWQQ3FgL4IHERxsluNpdj6bAqAacQckAEQBQWxfDzF4BUYYqBKhEEQNMDgPQGhFGIDgVwKR3iiCiIIIgig+BfA2MYOLtAqA4ESCYDIFgVDyGEKkPAQgFBDDwG4DYnQzg5GiDIOAZw3hCDoA8MQIA9PeGEHkRIyx6jiOMEoTAxRMhoCeIwUQKSbCKH6NgV43AECyFeEkEQdBTAxC0FESQYhgB+DGPcTwYBXBZEeCIOoKg5j6EIJAbQNxJCjCAMAJwDRxghA4DEBYpk1hnHwH4DIxg3AaFGGgMQFwHhBHgGkewhhCDIHMDkDY0AlAGEAIAgIA=")
	var_Appearance.Add(2,"c:\exontrol\images\normal.ebn")
	var_Appearance.Add(3,"CP:2 2 -4 2 4")
var_Chart = oG2antt.Chart
	' var_Chart.PaneWidth(.f.) = 256
	oG2antt.TemplateDef = "dim var_Chart"
	oG2antt.TemplateDef = var_Chart
	oG2antt.Template = "var_Chart.PaneWidth(0) = 256"

	var_Chart.LevelCount = 2
	var_Chart.FirstVisibleDate = {01/01/2001}
oG2antt.Columns.Add("Info")
var_Items = oG2antt.Items
	h = var_Items.AddItem("Range Moveable Frame")
	var_Items.AddBar(h,"Task",{01/04/2001},{01/08/2001},"F")
	' var_Items.ItemBar(h,"F",6) = "This bar can be moved inside the displayed range."
	oG2antt.TemplateDef = "dim var_Items,h"
	oG2antt.TemplateDef = var_Items
	oG2antt.TemplateDef = h
	oG2antt.Template = "var_Items.ItemBar(h,`F`,6) = `This bar can be moved inside the displayed range.`"

	' var_Items.ItemBar(h,"F",22) = {01/02/2001}
	oG2antt.TemplateDef = "dim var_Items,h"
	oG2antt.TemplateDef = var_Items
	oG2antt.TemplateDef = h
	oG2antt.Template = "var_Items.ItemBar(h,`F`,22) = #1/2/2001#"

	' var_Items.ItemBar(h,"F",25) = {01/18/2001}
	oG2antt.TemplateDef = "dim var_Items,h"
	oG2antt.TemplateDef = var_Items
	oG2antt.TemplateDef = h
	oG2antt.Template = "var_Items.ItemBar(h,`F`,25) = #1/18/2001#"

	' var_Items.ItemBar(h,"F",26) = 32
	oG2antt.TemplateDef = "dim var_Items,h"
	oG2antt.TemplateDef = var_Items
	oG2antt.TemplateDef = h
	oG2antt.Template = "var_Items.ItemBar(h,`F`,26) = 32"

	' var_Items.ItemBar(h,"F",27) = 90
	oG2antt.TemplateDef = "dim var_Items,h"
	oG2antt.TemplateDef = var_Items
	oG2antt.TemplateDef = h
	oG2antt.Template = "var_Items.ItemBar(h,`F`,27) = 90"

	h = var_Items.AddItem("Range Moveable Pattern")
	var_Items.AddBar(h,"Task",{01/06/2001},{01/10/2001},"F")
	' var_Items.ItemBar(h,"F",6) = "This bar can be moved inside the displayed range."
	oG2antt.TemplateDef = "dim var_Items,h"
	oG2antt.TemplateDef = var_Items
	oG2antt.TemplateDef = h
	oG2antt.Template = "var_Items.ItemBar(h,`F`,6) = `This bar can be moved inside the displayed range.`"

	' var_Items.ItemBar(h,"F",22) = {01/02/2001}
	oG2antt.TemplateDef = "dim var_Items,h"
	oG2antt.TemplateDef = var_Items
	oG2antt.TemplateDef = h
	oG2antt.Template = "var_Items.ItemBar(h,`F`,22) = #1/2/2001#"

	' var_Items.ItemBar(h,"F",25) = {01/18/2001}
	oG2antt.TemplateDef = "dim var_Items,h"
	oG2antt.TemplateDef = var_Items
	oG2antt.TemplateDef = h
	oG2antt.Template = "var_Items.ItemBar(h,`F`,25) = #1/18/2001#"

	' var_Items.ItemBar(h,"F",26) = 1
	oG2antt.TemplateDef = "dim var_Items,h"
	oG2antt.TemplateDef = var_Items
	oG2antt.TemplateDef = h
	oG2antt.Template = "var_Items.ItemBar(h,`F`,26) = 1"

	' var_Items.ItemBar(h,"F",27) = 90
	oG2antt.TemplateDef = "dim var_Items,h"
	oG2antt.TemplateDef = var_Items
	oG2antt.TemplateDef = h
	oG2antt.Template = "var_Items.ItemBar(h,`F`,27) = 90"

	h = var_Items.AddItem("Range Moveable EBN Transparent")
	var_Items.AddBar(h,"Task",{01/08/2001},{01/12/2001},"F")
	' var_Items.ItemBar(h,"F",6) = "This bar can be moved inside the displayed range."
	oG2antt.TemplateDef = "dim var_Items,h"
	oG2antt.TemplateDef = var_Items
	oG2antt.TemplateDef = h
	oG2antt.Template = "var_Items.ItemBar(h,`F`,6) = `This bar can be moved inside the displayed range.`"

	' var_Items.ItemBar(h,"F",22) = {01/02/2001}
	oG2antt.TemplateDef = "dim var_Items,h"
	oG2antt.TemplateDef = var_Items
	oG2antt.TemplateDef = h
	oG2antt.Template = "var_Items.ItemBar(h,`F`,22) = #1/2/2001#"

	' var_Items.ItemBar(h,"F",25) = {01/18/2001}
	oG2antt.TemplateDef = "dim var_Items,h"
	oG2antt.TemplateDef = var_Items
	oG2antt.TemplateDef = h
	oG2antt.Template = "var_Items.ItemBar(h,`F`,25) = #1/18/2001#"

	' var_Items.ItemBar(h,"F",26) = 16777216
	oG2antt.TemplateDef = "dim var_Items,h"
	oG2antt.TemplateDef = var_Items
	oG2antt.TemplateDef = h
	oG2antt.Template = "var_Items.ItemBar(h,`F`,26) = 16777216"

	' var_Items.ItemBar(h,"F",27) = 50
	oG2antt.TemplateDef = "dim var_Items,h"
	oG2antt.TemplateDef = var_Items
	oG2antt.TemplateDef = h
	oG2antt.Template = "var_Items.ItemBar(h,`F`,27) = 50"

	h = var_Items.AddItem("Range Moveable EBN Opaque 1")
	' var_Items.ItemHeight(h) = 24
	oG2antt.TemplateDef = "dim var_Items,h"
	oG2antt.TemplateDef = var_Items
	oG2antt.TemplateDef = h
	oG2antt.Template = "var_Items.ItemHeight(h) = 24"

	var_Items.AddBar(h,"Task",{01/10/2001},{01/14/2001},"F")
	' var_Items.ItemBar(h,"F",6) = "This bar can be moved inside the displayed range."
	oG2antt.TemplateDef = "dim var_Items,h"
	oG2antt.TemplateDef = var_Items
	oG2antt.TemplateDef = h
	oG2antt.Template = "var_Items.ItemBar(h,`F`,6) = `This bar can be moved inside the displayed range.`"

	' var_Items.ItemBar(h,"F",22) = {01/02/2001}
	oG2antt.TemplateDef = "dim var_Items,h"
	oG2antt.TemplateDef = var_Items
	oG2antt.TemplateDef = h
	oG2antt.Template = "var_Items.ItemBar(h,`F`,22) = #1/2/2001#"

	' var_Items.ItemBar(h,"F",25) = {01/18/2001}
	oG2antt.TemplateDef = "dim var_Items,h"
	oG2antt.TemplateDef = var_Items
	oG2antt.TemplateDef = h
	oG2antt.Template = "var_Items.ItemBar(h,`F`,25) = #1/18/2001#"

	' var_Items.ItemBar(h,"F",26) = 33554432
	oG2antt.TemplateDef = "dim var_Items,h"
	oG2antt.TemplateDef = var_Items
	oG2antt.TemplateDef = h
	oG2antt.Template = "var_Items.ItemBar(h,`F`,26) = 33554432"

	h = var_Items.AddItem("Range Moveable EBN Opaque 2")
	' var_Items.ItemHeight(h) = 24
	oG2antt.TemplateDef = "dim var_Items,h"
	oG2antt.TemplateDef = var_Items
	oG2antt.TemplateDef = h
	oG2antt.Template = "var_Items.ItemHeight(h) = 24"

	var_Items.AddBar(h,"Task",{01/12/2001},{01/16/2001},"F")
	' var_Items.ItemBar(h,"F",6) = "This bar can be moved inside the displayed range."
	oG2antt.TemplateDef = "dim var_Items,h"
	oG2antt.TemplateDef = var_Items
	oG2antt.TemplateDef = h
	oG2antt.Template = "var_Items.ItemBar(h,`F`,6) = `This bar can be moved inside the displayed range.`"

	' var_Items.ItemBar(h,"F",22) = {01/02/2001}
	oG2antt.TemplateDef = "dim var_Items,h"
	oG2antt.TemplateDef = var_Items
	oG2antt.TemplateDef = h
	oG2antt.Template = "var_Items.ItemBar(h,`F`,22) = #1/2/2001#"

	' var_Items.ItemBar(h,"F",25) = {01/18/2001}
	oG2antt.TemplateDef = "dim var_Items,h"
	oG2antt.TemplateDef = var_Items
	oG2antt.TemplateDef = h
	oG2antt.Template = "var_Items.ItemBar(h,`F`,25) = #1/18/2001#"

	' var_Items.ItemBar(h,"F",26) = 50331648
	oG2antt.TemplateDef = "dim var_Items,h"
	oG2antt.TemplateDef = var_Items
	oG2antt.TemplateDef = h
	oG2antt.Template = "var_Items.ItemBar(h,`F`,26) = 50331648"

oG2antt.EndUpdate()
|
|
1525
|
How can I show vertical lines using the SelectDate
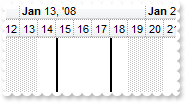
Dim oG2antt as P
Dim var_Appearance as P
Dim var_Chart as P

oG2antt = topparent:CONTROL_ACTIVEX1.activex
oG2antt.BeginUpdate()
var_Appearance = oG2antt.VisualAppearance
	var_Appearance.Add(1,"gBFLBCJwBAEHhEJAEGg4BK8IQAAYAQGKIYBkAKBQAGaAoDDYMwzQwAAxDMKEEwsACEIrjKCRShyCYZRhGcTAFD8EhhECTY4lCQJAiKLoeQLHMBybJ8LwiGQaRJmeaYRDUMI6QjPVARVIkaxhCSSaKpIAIBEB")
var_Chart = oG2antt.Chart
	' var_Chart.PaneWidth(.f.) = 0
	oG2antt.TemplateDef = "dim var_Chart"
	oG2antt.TemplateDef = var_Chart
	oG2antt.Template = "var_Chart.PaneWidth(False) = 0"

	var_Chart.FirstVisibleDate = {01/01/2008}
	var_Chart.MarkTodayColor = var_Chart.BackColor
	var_Chart.LevelCount = 2
	var_Chart.AllowSelectDate = .f.
	var_Chart.MarkSelectDateColor = 16777216
	var_Chart.SelectLevel = 1
	' var_Chart.SelectDate({01/15/2008}) = .t.
	oG2antt.TemplateDef = "dim var_Chart"
	oG2antt.TemplateDef = var_Chart
	oG2antt.Template = "var_Chart.SelectDate(#1/15/2008#) = True"

	' var_Chart.SelectDate({01/18/2008}) = .t.
	oG2antt.TemplateDef = "dim var_Chart"
	oG2antt.TemplateDef = var_Chart
	oG2antt.Template = "var_Chart.SelectDate(#1/18/2008#) = True"

oG2antt.EndUpdate()
|
|
1524
|
How can I show vertical lines using the SelectDate
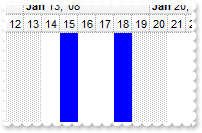
Dim oG2antt as P
Dim var_Chart as P

oG2antt = topparent:CONTROL_ACTIVEX1.activex
oG2antt.BeginUpdate()
var_Chart = oG2antt.Chart
	' var_Chart.PaneWidth(.f.) = 0
	oG2antt.TemplateDef = "dim var_Chart"
	oG2antt.TemplateDef = var_Chart
	oG2antt.Template = "var_Chart.PaneWidth(False) = 0"

	var_Chart.FirstVisibleDate = {01/01/2008}
	var_Chart.MarkTodayColor = var_Chart.BackColor
	var_Chart.LevelCount = 2
	var_Chart.AllowSelectDate = .f.
	var_Chart.MarkSelectDateColor = 2147418112
	var_Chart.SelectLevel = 1
	' var_Chart.SelectDate({01/15/2008}) = .t.
	oG2antt.TemplateDef = "dim var_Chart"
	oG2antt.TemplateDef = var_Chart
	oG2antt.Template = "var_Chart.SelectDate(#1/15/2008#) = True"

	' var_Chart.SelectDate({01/18/2008}) = .t.
	oG2antt.TemplateDef = "dim var_Chart"
	oG2antt.TemplateDef = var_Chart
	oG2antt.Template = "var_Chart.SelectDate(#1/18/2008#) = True"

oG2antt.EndUpdate()
|
|
1523
|
How can I find if there is any filter applied to the control
' Occurs when the filter was changed.
function FilterChange as v ()
	oG2antt = topparent:CONTROL_ACTIVEX1.activex
	? "If negative, the filter is present, else not"
	? oG2antt.Items.VisibleItemCount
end function

Dim h as N
Dim oG2antt as P
Dim var_Column as P
Dim var_Items as P

oG2antt = topparent:CONTROL_ACTIVEX1.activex
oG2antt.BeginUpdate()
oG2antt.LinesAtRoot = -1
oG2antt.TreeColumnIndex = -1
oG2antt.FilterInclude = 4
var_Column = oG2antt.Columns.Add("Column")
	var_Column.DisplayFilterButton = .t.
	var_Column.FilterType = 240
	var_Column.Filter = "C1"
var_Items = oG2antt.Items
	h = var_Items.AddItem("R1")
	var_Items.InsertItem(h,,"C1")
	var_Items.InsertItem(h,,"C2")
	' var_Items.ExpandItem(h) = .t.
	oG2antt.TemplateDef = "dim var_Items,h"
	oG2antt.TemplateDef = var_Items
	oG2antt.TemplateDef = h
	oG2antt.Template = "var_Items.ExpandItem(h) = True"

	h = var_Items.AddItem("R2")
	var_Items.InsertItem(h,,"C1")
	var_Items.InsertItem(h,,"C2")
oG2antt.ApplyFilter()
oG2antt.EndUpdate()
|
|
1522
|
How can I prevent showing the lines for the hierarchy while using the exMatchingItemsOnly option
Dim h as N
Dim oG2antt as P
Dim var_Column as P
Dim var_Items as P

oG2antt = topparent:CONTROL_ACTIVEX1.activex
oG2antt.BeginUpdate()
oG2antt.LinesAtRoot = -1
oG2antt.TreeColumnIndex = -1
oG2antt.FilterInclude = 4
var_Column = oG2antt.Columns.Add("Column")
	var_Column.DisplayFilterButton = .t.
	var_Column.FilterType = 240
	var_Column.Filter = "C1|C2"
var_Items = oG2antt.Items
	h = var_Items.AddItem("R1")
	var_Items.InsertItem(h,,"C1")
	var_Items.InsertItem(h,,"C2")
	' var_Items.ExpandItem(h) = .t.
	oG2antt.TemplateDef = "dim var_Items,h"
	oG2antt.TemplateDef = var_Items
	oG2antt.TemplateDef = h
	oG2antt.Template = "var_Items.ExpandItem(h) = True"

	h = var_Items.AddItem("R2")
	var_Items.InsertItem(h,,"C1")
	var_Items.InsertItem(h,,"C2")
oG2antt.ApplyFilter()
oG2antt.EndUpdate()
|
|
1521
|
Is there any method to get only the matched items and not the items with his parent
Dim h as N
Dim oG2antt as P
Dim var_Column as P
Dim var_Items as P

oG2antt = topparent:CONTROL_ACTIVEX1.activex
oG2antt.BeginUpdate()
oG2antt.LinesAtRoot = -1
oG2antt.FilterInclude = 4
var_Column = oG2antt.Columns.Add("Column")
	var_Column.DisplayFilterButton = .t.
	var_Column.FilterType = 240
	var_Column.Filter = "C1|C2"
var_Items = oG2antt.Items
	h = var_Items.AddItem("R1")
	var_Items.InsertItem(h,,"C1")
	var_Items.InsertItem(h,,"C2")
	' var_Items.ExpandItem(h) = .t.
	oG2antt.TemplateDef = "dim var_Items,h"
	oG2antt.TemplateDef = var_Items
	oG2antt.TemplateDef = h
	oG2antt.Template = "var_Items.ExpandItem(h) = True"

	h = var_Items.AddItem("R2")
	var_Items.InsertItem(h,,"C1")
	var_Items.InsertItem(h,,"C2")
oG2antt.ApplyFilter()
oG2antt.EndUpdate()
|
|
1520
|
Is it possible to specify a working day exception that would override the non-working day pattern
Dim oG2antt as P
Dim var_Chart as P
Dim var_Items as P

oG2antt = topparent:CONTROL_ACTIVEX1.activex
oG2antt.BeginUpdate()
oG2antt.Columns.Add("Pattern")
var_Chart = oG2antt.Chart
	var_Chart.FirstWeekDay = 1
	var_Chart.FirstVisibleDate = {01/24/2008}
	' var_Chart.PaneWidth(.f.) = 52
	oG2antt.TemplateDef = "dim var_Chart"
	oG2antt.TemplateDef = var_Chart
	oG2antt.Template = "var_Chart.PaneWidth(False) = 52"

	var_Chart.LevelCount = 2
var_Items = oG2antt.Items
	var_Items.AddItem("Default")
	' var_Items.ItemNonworkingUnits(var_Items.AddItem("1/26/2008"),.f.) = "weekday(value) case (default:0 ; 0:1; 6:(value != #1/26/2008#))"
	oG2antt.TemplateDef = "dim var_Items"
	oG2antt.TemplateDef = var_Items
	oG2antt.Template = "var_Items.ItemNonworkingUnits(AddItem(`1/26/2008`),False) = `weekday(value) case (default:0 ; 0:1; 6:(value != #1/26/2008#))`"

	' var_Items.ItemNonworkingUnits(var_Items.AddItem("1/27/2008"),.f.) = "weekday(value) case (default:0 ; 0:(value != #1/27/2008#); 6:1)"
	oG2antt.TemplateDef = "dim var_Items"
	oG2antt.TemplateDef = var_Items
	oG2antt.Template = "var_Items.ItemNonworkingUnits(AddItem(`1/27/2008`),False) = `weekday(value) case (default:0 ; 0:(value != #1/27/2008#); 6:1)`"

	' var_Items.ItemNonworkingUnits(var_Items.AddItem("Sundays"),.f.) = "weekday(value) = 0"
	oG2antt.TemplateDef = "dim var_Items"
	oG2antt.TemplateDef = var_Items
	oG2antt.Template = "var_Items.ItemNonworkingUnits(AddItem(`Sundays`),False) = `weekday(value) = 0`"

oG2antt.EndUpdate()
|
|
1519
|
How do I enable the scrollbar-extension, as thumb to be shown outside of the control's client area
Dim oG2antt as P

oG2antt = topparent:CONTROL_ACTIVEX1.activex
oG2antt.BeginUpdate()
oG2antt.ScrollBars = 15
oG2antt.Chart.ToolTip = ""
oG2antt.Template = "ScrollPartVisible(0,65536) = True" // oG2antt.ScrollPartVisible(0,65536) = .t.
oG2antt.Template = "ScrollPartVisible(1,65536) = True" // oG2antt.ScrollPartVisible(1,65536) = .t.
oG2antt.Template = "ScrollPartVisible(2,65536) = True" // oG2antt.ScrollPartVisible(2,65536) = .t.
oG2antt.ScrollWidth = 4
oG2antt.Template = "Background(276) = 15790320" // oG2antt.Background(276) = 15790320
oG2antt.Template = "Background(260) = 8421504" // oG2antt.Background(260) = 8421504
oG2antt.ScrollHeight = 4
oG2antt.Template = "Background(404) = Background(276)" // oG2antt.Background(404) = oG2antt.Background(276)
oG2antt.Template = "Background(388) = Background(260)" // oG2antt.Background(388) = oG2antt.Background(260)
oG2antt.Template = "Background(511) = Background(276)" // oG2antt.Background(511) = oG2antt.Background(276)
oG2antt.EndUpdate()
|
|
1518
|
Is it possible to associate an extra frame, border, EBN to the bar/task
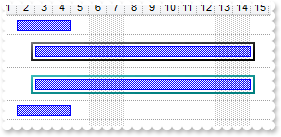
Dim h as N
Dim oG2antt as P
Dim var_Appearance as P
Dim var_Chart as P
Dim var_Items as P

oG2antt = topparent:CONTROL_ACTIVEX1.activex
oG2antt.BeginUpdate()
var_Appearance = oG2antt.VisualAppearance
	var_Appearance.Add(1,"gBFLBCJwBAEHhEJAEGg4BNACg6AADACAxRDAMgBQKAAzQFAYbhsGCGAAGEZBQgmFgAQhFcZQSKUOQTDKMIziYBYfgkMIgSbJUgDEAkRRdDSOYDmGQYDiCIoRShOMaTVJ8bQ2ASEaAmWK3boUAJFPrFc6ABJMZRRISXJABeKwRoGJYaUhRdDRNCIZBqEqua7iEZRQqCCZkWZPNTRVScByhF61IDpWjKLDKJJwXBMcxyBL0NRxFTAKawGoYbq0AJQVTQcZPVhgAYYfSlMDuOB5Gq+G5SQjhWIgBjde4dRrHYrsGyQAp7JJoWLZMQyFIFIYNTS8LgpPI6LyyP5rABhWw5PiUVyfWTMdwzPatbyKHJicbpepWPxcNYtNzcNb3SAbn+KgAmqP5yDiIAACIEhQDSGJOgcU4RhQYwgFUQwIESXxEGgbQJBQQhzHmUAAGILh0lWbpEGIIQQHuegaAaoRYBUBYBCgFAOAOQJgC4CgCCCQAUAQARACgRZFEa3ogCcCICDCDZ9AeH5wGgFoHmAUBIA6CJgiALgMAIABYiYER+BuMIyC4CZjAcYgygyYxIlYNoNBGMJGDoCximiXg+g+Yx0G0DgNiOIJGECEZkgQbA7A8A5JA4SITmOZBsEGFJDkkLhQhXOItBYEZEGEHBCBARApGIYh1EAaIoAMQIEkENBNBGZpJg4YgCGcAAaGUAAFCmVhqBMZppGADQDACQAmAwAAFgoBh1BSJ4ZFwEEdHmcFmgWag2gEFhoFlINYkoHAQAABhKGQX4jGkGQ8BiJ5BDqBAABqKl1GSJxkgAcoqAYAR3lQcIrkaOoSiiEZCBCBAgiqAaJHaLpHBqQoliaBZxHwWYwkUQRMFQExEmENBJBIRIBAgQwQkOYJ0D4DhDgCYAzjWQpgjwLgKi2QIWl4CACADeofC4SpsHcHArlqRBqBkbpLAaQoxAUQRQE6PLoCaT40AOYJ6lWNdXlAL4/m2QIql4CRAAQBCAg=")
	var_Appearance.Add(2,"CP:1 -4 -4 4 4")
oG2antt.Columns.Add("Task")
oG2antt.DrawGridLines = -1
var_Chart = oG2antt.Chart
	var_Chart.FirstVisibleDate = {01/01/2001}
	' var_Chart.PaneWidth(.f.) = 128
	oG2antt.TemplateDef = "dim var_Chart"
	oG2antt.TemplateDef = var_Chart
	oG2antt.Template = "var_Chart.PaneWidth(False) = 128"

	var_Chart.DrawGridLines = -1
var_Items = oG2antt.Items
	var_Items.AddBar(var_Items.AddItem("Task"),"Task",{01/02/2001},{01/05/2001},"K1")
	h = var_Items.AddItem("Task/ EBN Frame")
	' var_Items.ItemHeight(h) = 32
	oG2antt.TemplateDef = "dim var_Items,h"
	oG2antt.TemplateDef = var_Items
	oG2antt.TemplateDef = h
	oG2antt.Template = "var_Items.ItemHeight(h) = 32"

	var_Items.AddBar(h,"Task",{01/03/2001},{01/15/2001},"K2")
	' var_Items.ItemBar(h,"K2",51) = 33554432
	oG2antt.TemplateDef = "dim var_Items,h"
	oG2antt.TemplateDef = var_Items
	oG2antt.TemplateDef = h
	oG2antt.Template = "var_Items.ItemBar(h,`K2`,51) = 33554432"

	h = var_Items.AddItem("Task/ EBN Frame")
	' var_Items.ItemHeight(h) = 32
	oG2antt.TemplateDef = "dim var_Items,h"
	oG2antt.TemplateDef = var_Items
	oG2antt.TemplateDef = h
	oG2antt.Template = "var_Items.ItemHeight(h) = 32"

	var_Items.AddBar(h,"Task",{01/03/2001},{01/15/2001},"K2")
	' var_Items.ItemBar(h,"K2",51) = 50331392
	oG2antt.TemplateDef = "dim var_Items,h"
	oG2antt.TemplateDef = var_Items
	oG2antt.TemplateDef = h
	oG2antt.Template = "var_Items.ItemBar(h,`K2`,51) = 50331392"

	var_Items.AddBar(var_Items.AddItem("Task"),"Task",{01/02/2001},{01/05/2001},"K3")
oG2antt.EndUpdate()
|
|
1517
|
Is it possible to automatically display the working days duration in a column
Dim h as N
Dim oG2antt as P
Dim var_Chart as P
Dim var_Column as P
Dim var_Column1 as P
Dim var_Columns as P
Dim var_Items as P

oG2antt = topparent:CONTROL_ACTIVEX1.activex
oG2antt.BeginUpdate()
var_Columns = oG2antt.Columns
	var_Columns.Add("Tasks")
	var_Column = var_Columns.Add("Duration")
		' var_Column.Def(18) = 513
		oG2antt.TemplateDef = "dim var_Column"
		oG2antt.TemplateDef = var_Column
		oG2antt.Template = "var_Column.Def(18) = 513"

		' var_Column.Def(19) = "A"
		oG2antt.TemplateDef = "dim var_Column"
		oG2antt.TemplateDef = var_Column
		oG2antt.Template = "var_Column.Def(19) = `A`"

	var_Column1 = var_Columns.Add("Working")
		' var_Column1.Def(18) = 258
		oG2antt.TemplateDef = "dim var_Column1"
		oG2antt.TemplateDef = var_Column1
		oG2antt.Template = "var_Column1.Def(18) = 258"

		' var_Column1.Def(19) = "A"
		oG2antt.TemplateDef = "dim var_Column1"
		oG2antt.TemplateDef = var_Column1
		oG2antt.Template = "var_Column1.Def(19) = `A`"

oG2antt.Items.AllowCellValueToItemBar = .t.
var_Chart = oG2antt.Chart
	' var_Chart.PaneWidth(.f.) = 256
	oG2antt.TemplateDef = "dim var_Chart"
	oG2antt.TemplateDef = var_Chart
	oG2antt.Template = "var_Chart.PaneWidth(False) = 256"

	var_Chart.FirstVisibleDate = {01/03/2002}
	var_Chart.LevelCount = 2
var_Items = oG2antt.Items
	h = var_Items.AddItem("Task 1")
	var_Items.AddBar(h,"Task",{01/04/2002},{01/08/2002},"A")
oG2antt.EndUpdate()
|
|
1516
|
How can I apply colors to columns section of the control based on properties of the displaying bars
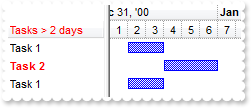
' Occurs when a bar is moved or resized.
function BarResize as v (Item  as  OLE::Exontrol.G2antt.1::HITEM, Key  as  A)
	oG2antt = topparent:CONTROL_ACTIVEX1.activex
	oG2antt.Refresh()
end function

Dim oG2antt as P
Dim var_Chart as P
Dim var_Column as P
Dim var_Column1 as P
Dim var_ConditionalFormat as P
Dim var_Items as P

oG2antt = topparent:CONTROL_ACTIVEX1.activex
oG2antt.BeginUpdate()
var_Column = oG2antt.Columns.Add("<fgcolor=FF0000>Tasks > 2 days")
	var_Column.HTMLCaption = var_Column.Caption
var_Column1 = oG2antt.Columns.Add("PropertyBar")
	var_Column1.Visible = .f.
	' var_Column1.Def(19) = ""
	oG2antt.TemplateDef = "dim var_Column1"
	oG2antt.TemplateDef = var_Column1
	oG2antt.Template = "var_Column1.Def(19) = ``"

	' var_Column1.Def(18) = 513
	oG2antt.TemplateDef = "dim var_Column1"
	oG2antt.TemplateDef = var_Column1
	oG2antt.Template = "var_Column1.Def(18) = 513"

oG2antt.Items.AllowCellValueToItemBar = .t.
var_Chart = oG2antt.Chart
	var_Chart.LevelCount = 2
	var_Chart.FirstVisibleDate = {01/01/2001}
	' var_Chart.PaneWidth(.f.) = 96
	oG2antt.TemplateDef = "dim var_Chart"
	oG2antt.TemplateDef = var_Chart
	oG2antt.Template = "var_Chart.PaneWidth(False) = 96"

	var_Chart.NonworkingDays = 0
var_ConditionalFormat = oG2antt.ConditionalFormats.Add("%1 > 2")
	var_ConditionalFormat.ForeColor = 255
	var_ConditionalFormat.Bold = .t.
oG2antt.SelBackColor = oG2antt.BackColor
oG2antt.SelForeColor = oG2antt.ForeColor
var_Items = oG2antt.Items
	var_Items.AddBar(var_Items.AddItem("Task 1"),"Task",{01/02/2001},{01/04/2001},"")
	var_Items.AddBar(var_Items.AddItem("Task 2"),"Task",{01/04/2001},{01/07/2001},"")
	var_Items.AddBar(var_Items.AddItem("Task 1"),"Task",{01/02/2001},{01/04/2001},"")
oG2antt.EndUpdate()
|
|
1515
|
Is it possible to update the colors on columns caption to highlight the critical path ( CPM )
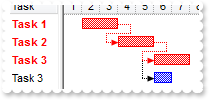
' Occurs when a bar is moved or resized.
function BarResize as v (Item  as  OLE::Exontrol.G2antt.1::HITEM, Key  as  A)
	oG2antt = topparent:CONTROL_ACTIVEX1.activex
	oG2antt.Items.SchedulePDM(Item,Key)
	oG2antt.Refresh()
end function

Dim h1 as N
Dim h2 as N
Dim h3 as N
Dim h4 as N
Dim oG2antt as P
Dim var_Chart as P
Dim var_Column as P
Dim var_ConditionalFormat as P
Dim var_Items as P

oG2antt = topparent:CONTROL_ACTIVEX1.activex
oG2antt.BeginUpdate()
oG2antt.Columns.Add("Task")
var_Column = oG2antt.Columns.Add("PropertyBar")
	var_Column.Visible = .f.
	' var_Column.Def(19) = ""
	oG2antt.TemplateDef = "dim var_Column"
	oG2antt.TemplateDef = var_Column
	oG2antt.Template = "var_Column.Def(19) = ``"

	' var_Column.Def(18) = 269
	oG2antt.TemplateDef = "dim var_Column"
	oG2antt.TemplateDef = var_Column
	oG2antt.Template = "var_Column.Def(18) = 269"

oG2antt.Items.AllowCellValueToItemBar = .t.
var_Chart = oG2antt.Chart
	var_Chart.FirstVisibleDate = {01/01/2001}
	' var_Chart.PaneWidth(.f.) = 48
	oG2antt.TemplateDef = "dim var_Chart"
	oG2antt.TemplateDef = var_Chart
	oG2antt.Template = "var_Chart.PaneWidth(False) = 48"

	var_Chart.NonworkingDays = 0
var_ConditionalFormat = oG2antt.ConditionalFormats.Add("%1 != 0")
	var_ConditionalFormat.ForeColor = 255
	var_ConditionalFormat.Bold = .t.
oG2antt.SelBackColor = oG2antt.BackColor
oG2antt.SelForeColor = oG2antt.ForeColor
var_Items = oG2antt.Items
	h1 = var_Items.AddItem("Task 1")
	var_Items.AddBar(h1,"Task",{01/02/2001},{01/04/2001},"")
	h2 = var_Items.AddItem("Task 2")
	var_Items.AddBar(h2,"Task",{01/02/2001},{01/04/2001},"")
	var_Items.AddLink("L1",h1,"",h2,"")
	h3 = var_Items.AddItem("Task 3")
	var_Items.AddBar(h3,"Task",{01/02/2001},{01/04/2001},"")
	var_Items.AddLink("L2",h2,"",h3,"")
	h4 = var_Items.AddItem("Task 3")
	var_Items.AddBar(h4,"Task",{01/02/2001},{01/03/2001},"")
	var_Items.AddLink("L3",h2,"",h4,"")
	' var_Items.DefSchedulePDM(5) = 255
	oG2antt.TemplateDef = "dim var_Items"
	oG2antt.TemplateDef = var_Items
	oG2antt.Template = "var_Items.DefSchedulePDM(5) = 255"

	' var_Items.DefSchedulePDM(7) = 255
	oG2antt.TemplateDef = "dim var_Items"
	oG2antt.TemplateDef = var_Items
	oG2antt.Template = "var_Items.DefSchedulePDM(7) = 255"

	var_Items.SchedulePDM(0,"")
oG2antt.EndUpdate()
|
|
1514
|
I am using the AddShapeCorner to define icon-bars. Is it possible to define with a different color
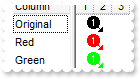
Dim oG2antt as P
Dim var_Bar as P
Dim var_Bar1 as P
Dim var_Bar2 as P
Dim var_Bars as P
Dim var_Chart as P
Dim var_Items as P

oG2antt = topparent:CONTROL_ACTIVEX1.activex
oG2antt.BeginUpdate()
oG2antt.Images("gBJJgBAIDAAGAAEAAQhYAf8Pf4hh0QihCJo2AEZjQAjEZFEaIEaEEaAIAkcbk0olUrlktl0vmExmUzmk1m03nE5nU7nk9n0/oFBoVDolFo1HpFJpVLplNp1PqFRqVTqlVq1XrFZrVbrldr1fsFhsVjslls1ntFptVrtltt1vuFxuVzul1u13vF5vV7vl9v1/wGBwWDwmFw2HxGJxWLxmNx0xiFdyOTh8Tf9ZymXx+QytcyNgz8r0OblWjyWds+m0ka1Vf1ta1+r1mos2xrG2xeZ0+a0W0qOx3GO4NV3WeyvD2XJ5XL5nN51aiw+lfSj0gkUkAEllHanHI5j/cHg8EZf7w8vl8j4f/qfEZeB09/vjLAB30+kZQAP/P5/H6/yNAOAEAwCjMBwFAEDwJBMDwLBYAP2/8Hv8/gAGAD8LQs9w/nhDY/oygIA=")
var_Chart = oG2antt.Chart
	var_Chart.FirstVisibleDate = {01/01/2001}
	' var_Chart.PaneWidth(.f.) = 128
	oG2antt.TemplateDef = "dim var_Chart"
	oG2antt.TemplateDef = var_Chart
	oG2antt.Template = "var_Chart.PaneWidth(False) = 128"

	var_Bars = var_Chart.Bars
		var_Bars.AddShapeCorner(12345,1)
		var_Bar = var_Bars.Copy("Milestone","Original")
			var_Bar.StartShape = 12345 '3020 + exShapeIconVBar + exShapeIconRight
			var_Bar.StartColor = -1
		var_Bar1 = var_Bars.Copy("Milestone","Red")
			var_Bar1.StartShape = 12345 '3020 + exShapeIconVBar + exShapeIconRight
			var_Bar1.StartColor = 255
		var_Bar2 = var_Bars.Copy("Milestone","Green")
			var_Bar2.StartShape = 12345 '3020 + exShapeIconVBar + exShapeIconRight
			var_Bar2.StartColor = 65280
oG2antt.Columns.Add("Column")
var_Items = oG2antt.Items
	var_Items.AddBar(var_Items.AddItem("Original"),"Original",{01/02/2001},{01/02/2001})
	var_Items.AddBar(var_Items.AddItem("Red"),"Red",{01/02/2001},{01/02/2001})
	var_Items.AddBar(var_Items.AddItem("Green"),"Green",{01/02/2001},{01/02/2001})
oG2antt.EndUpdate()
|
|
1513
|
My icon-bars shows different when displaying in the chart. Any ideas
Dim oG2antt as P
Dim var_Bar as P
Dim var_Bars as P
Dim var_Items as P

oG2antt = topparent:CONTROL_ACTIVEX1.activex
oG2antt.Images("gBJJgBAIDAAGAAEAAQhYAf8Pf4hh0QihCJo2AEZjQAjEZFEaIEaEEaAIAkcbk0olUrlktl0vmExmUzmk1m03nE5nU7nk9n0/oFBoVDolFo1HpFJpVLplNp1PqFRqVTqlVq1XrFZrVbrldr1fsFhsVjslls1ntFptVrtltt1vuFxuVzul1u13vF5vV7vl9v1/wGBwWDwmFw2HxGJxWLxmNx0xiFdyOTh8Tf9ZymXx+QytcyNgz8r0OblWjyWds+m0ka1Vf1ta1+r1mos2xrG2xeZ0+a0W0qOx3GO4NV3WeyvD2XJ5XL5nN51aiw+lfSj0gkUkAEllHanHI5j/cHg8EZf7w8vl8j4f/qfEZeB09/vjLAB30+kZQAP/P5/H6/yNAOAEAwCjMBwFAEDwJBMDwLBYAP2/8Hv8/gAGAD8LQs9w/nhDY/oygIA=")
oG2antt.Chart.FirstVisibleDate = {01/01/2001}
var_Bars = oG2antt.Chart.Bars
	var_Bars.AddShapeCorner(12345,1)
	var_Bar = var_Bars.Item("Milestone")
		var_Bar.StartShape = 12345 '3020 + exShapeIconVBar + exShapeIconRight
		var_Bar.StartColor = -1
oG2antt.Columns.Add("Column")
var_Items = oG2antt.Items
	var_Items.AddBar(var_Items.AddItem("Item 1"),"Milestone",{01/02/2001},{01/02/2001})
|
|
1512
|
The items are not colored in the chart panel
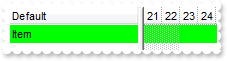
Dim h as N
Dim oG2antt as P
Dim var_Chart as local
Dim var_Chart1 as local
Dim var_Items as P
Dim var_Items1 as local

oG2antt = topparent:CONTROL_ACTIVEX1.activex
' oG2antt.Chart.PaneWidth(.f.) = 128
var_Chart = oG2antt.Chart
oG2antt.TemplateDef = "dim var_Chart"
oG2antt.TemplateDef = var_Chart
oG2antt.Template = "var_Chart.PaneWidth(False) = 128"

oG2antt.Columns.Add("Default")
var_Items = oG2antt.Items
	h = var_Items.AddItem("Item")
	' oG2antt.Chart.ItemBackColor(h) = 65280
	var_Chart1 = oG2antt.Chart
	oG2antt.TemplateDef = "dim var_Chart1"
	oG2antt.TemplateDef = var_Chart1
	oG2antt.Template = "Me.Chart.ItemBackColor(h) = 65280"

	' oG2antt.Items.ItemBackColor(h) = 65280
	var_Items1 = oG2antt.Items
	oG2antt.TemplateDef = "dim var_Items1"
	oG2antt.TemplateDef = var_Items1
	oG2antt.Template = "Me.Items.ItemBackColor(h) = 65280"
|
|
1511
|
I need to know how to determine the critical path (CPM) after the SchedulePDM procedure, so I can turn red the bars and links
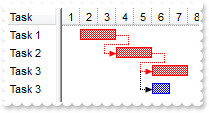
' Occurs when a bar is moved or resized.
function BarResize as v (Item  as  OLE::Exontrol.G2antt.1::HITEM, Key  as  A)
	oG2antt = topparent:CONTROL_ACTIVEX1.activex
	oG2antt.Items.SchedulePDM(Item,Key)
end function

Dim h1 as N
Dim h2 as N
Dim h3 as N
Dim h4 as N
Dim oG2antt as P
Dim var_Chart as P
Dim var_Items as P

oG2antt = topparent:CONTROL_ACTIVEX1.activex
oG2antt.BeginUpdate()
oG2antt.Columns.Add("Task")
var_Chart = oG2antt.Chart
	var_Chart.FirstVisibleDate = {01/01/2001}
	' var_Chart.PaneWidth(.f.) = 48
	oG2antt.TemplateDef = "dim var_Chart"
	oG2antt.TemplateDef = var_Chart
	oG2antt.Template = "var_Chart.PaneWidth(False) = 48"

	var_Chart.NonworkingDays = 0
var_Items = oG2antt.Items
	h1 = var_Items.AddItem("Task 1")
	var_Items.AddBar(h1,"Task",{01/02/2001},{01/04/2001},"K1")
	h2 = var_Items.AddItem("Task 2")
	var_Items.AddBar(h2,"Task",{01/02/2001},{01/04/2001},"K2")
	var_Items.AddLink("L1",h1,"K1",h2,"K2")
	h3 = var_Items.AddItem("Task 3")
	var_Items.AddBar(h3,"Task",{01/02/2001},{01/04/2001},"K3")
	var_Items.AddLink("L2",h2,"K2",h3,"K3")
	h4 = var_Items.AddItem("Task 3")
	var_Items.AddBar(h4,"Task",{01/02/2001},{01/03/2001},"K4")
	var_Items.AddLink("L3",h2,"K2",h4,"K4")
	' var_Items.DefSchedulePDM(5) = 255
	oG2antt.TemplateDef = "dim var_Items"
	oG2antt.TemplateDef = var_Items
	oG2antt.Template = "var_Items.DefSchedulePDM(5) = 255"

	' var_Items.DefSchedulePDM(7) = 255
	oG2antt.TemplateDef = "dim var_Items"
	oG2antt.TemplateDef = var_Items
	oG2antt.Template = "var_Items.DefSchedulePDM(7) = 255"

	var_Items.SchedulePDM(0,"K1")
oG2antt.EndUpdate()
|
|
1510
|
How can I display the Year in Thai, Buddhist, Korean format
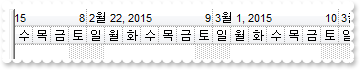
Dim oG2antt as P
Dim var_Chart as P
Dim var_Level as P

oG2antt = topparent:CONTROL_ACTIVEX1.activex
var_Chart = oG2antt.Chart
	var_Chart.FirstWeekDay = var_Chart.LocFirstWeekDay
	var_Chart.MonthNames = var_Chart.LocMonthNames
	var_Chart.WeekDays = var_Chart.LocWeekDays
	var_Chart.AMPM = var_Chart.LocAMPM
	var_Chart.LevelCount = 2
	' var_Chart.PaneWidth(.f.) = 0
	oG2antt.TemplateDef = "dim var_Chart"
	oG2antt.TemplateDef = var_Chart
	oG2antt.Template = "var_Chart.PaneWidth(False) = 0"

	var_Chart.UnitScale = 4096
	var_Level = var_Chart.Level(0)
		var_Level.Label = "<%mmmm%> <%d%>, <%loc_yyyy%> <r><%ww%>"
		var_Level.Unit = 256
		var_Level.ToolTip = var_Level.Label
	var_Chart.ToolTip = "<%ddd%> <%m%>/<%d%>/<%loc_yyyy%>"
oG2antt.Template = "Description(17) = Chart.MonthNames" // oG2antt.Description(17) = oG2antt.Chart.MonthNames
oG2antt.Template = "DefaultEditorOption(30) = Chart.MonthNames" // oG2antt.DefaultEditorOption(30) = oG2antt.Chart.MonthNames
|
|
1509
|
How does localization work
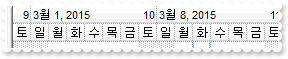
Dim oG2antt as P
Dim var_Chart as P

oG2antt = topparent:CONTROL_ACTIVEX1.activex
var_Chart = oG2antt.Chart
	var_Chart.FirstWeekDay = var_Chart.LocFirstWeekDay
	var_Chart.MonthNames = var_Chart.LocMonthNames
	var_Chart.WeekDays = var_Chart.LocWeekDays
	var_Chart.AMPM = var_Chart.LocAMPM
	var_Chart.LevelCount = 2
	' var_Chart.PaneWidth(.f.) = 0
	oG2antt.TemplateDef = "dim var_Chart"
	oG2antt.TemplateDef = var_Chart
	oG2antt.Template = "var_Chart.PaneWidth(False) = 0"
|
|
1508
|
Is it possible to show the bars with a different brightness (2)
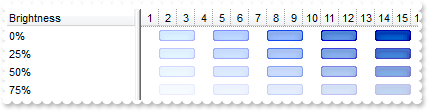
Dim h as N
Dim oG2antt as P
Dim var_Appearance as P
Dim var_Bar as local
Dim var_Bar1 as local
Dim var_Bar2 as local
Dim var_Bar3 as local
Dim var_Chart as P
Dim var_Items as P

oG2antt = topparent:CONTROL_ACTIVEX1.activex
var_Appearance = oG2antt.VisualAppearance
	var_Appearance.Add(1,"C:/Program Files/Exontrol/ExG2antt/Sample/EBN/2task--.ebn")
	var_Appearance.Add(2,"C:/Program Files/Exontrol/ExG2antt/Sample/EBN/2task-.ebn")
	var_Appearance.Add(3,"C:/Program Files/Exontrol/ExG2antt/Sample/EBN/2task.ebn")
	var_Appearance.Add(4,"C:/Program Files/Exontrol/ExG2antt/Sample/EBN/2task+.ebn")
	var_Appearance.Add(5,"C:/Program Files/Exontrol/ExG2antt/Sample/EBN/2task++.ebn")
var_Chart = oG2antt.Chart
	var_Chart.FirstVisibleDate = {01/01/2001}
	' var_Chart.PaneWidth(.f.) = 128
	oG2antt.TemplateDef = "dim var_Chart"
	oG2antt.TemplateDef = var_Chart
	oG2antt.Template = "var_Chart.PaneWidth(False) = 128"

	var_Chart.NonworkingDays = 0
	' var_Chart.Bars.Copy("Task","--").Color = 16777216
	var_Bar = var_Chart.Bars.Copy("Task","--")
	oG2antt.TemplateDef = "dim var_Bar"
	oG2antt.TemplateDef = var_Bar
	oG2antt.Template = "var_Bar.Color = 16777216"

	' var_Chart.Bars.Copy("Task","-").Color = 33554432
	var_Bar1 = var_Chart.Bars.Copy("Task","-")
	oG2antt.TemplateDef = "dim var_Bar1"
	oG2antt.TemplateDef = var_Bar1
	oG2antt.Template = "var_Bar1.Color = 33554432"

	var_Chart.Bars.Item("Task").Color = 50331648
	' var_Chart.Bars.Copy("Task","+").Color = 67108864
	var_Bar2 = var_Chart.Bars.Copy("Task","+")
	oG2antt.TemplateDef = "dim var_Bar2"
	oG2antt.TemplateDef = var_Bar2
	oG2antt.Template = "var_Bar2.Color = 67108864"

	' var_Chart.Bars.Copy("Task","++").Color = 83886080
	var_Bar3 = var_Chart.Bars.Copy("Task","++")
	oG2antt.TemplateDef = "dim var_Bar3"
	oG2antt.TemplateDef = var_Bar3
	oG2antt.Template = "var_Bar3.Color = 83886080"

oG2antt.Columns.Add("Brightness")
var_Items = oG2antt.Items
	h = var_Items.AddItem("0%")
	var_Items.AddBar(h,"--",{01/02/2001},{01/04/2001},"--")
	var_Items.AddBar(h,"-",{01/05/2001},{01/07/2001},"-")
	var_Items.AddBar(h,"Task",{01/08/2001},{01/10/2001},"")
	var_Items.AddBar(h,"+",{01/11/2001},{01/13/2001},"+")
	var_Items.AddBar(h,"++",{01/14/2001},{01/16/2001},"++")
	h = var_Items.AddItem("25%")
	var_Items.AddBar(h,"--",{01/02/2001},{01/04/2001},"--")
	var_Items.AddBar(h,"-",{01/05/2001},{01/07/2001},"-")
	var_Items.AddBar(h,"Task",{01/08/2001},{01/10/2001},"")
	var_Items.AddBar(h,"+",{01/11/2001},{01/13/2001},"+")
	var_Items.AddBar(h,"++",{01/14/2001},{01/16/2001},"++")
	' var_Items.ItemBar(h,"<*>",19) = 25
	oG2antt.TemplateDef = "dim var_Items,h"
	oG2antt.TemplateDef = var_Items
	oG2antt.TemplateDef = h
	oG2antt.Template = "var_Items.ItemBar(h,`<*>`,19) = 25"

	h = var_Items.AddItem("50%")
	var_Items.AddBar(h,"--",{01/02/2001},{01/04/2001},"--")
	var_Items.AddBar(h,"-",{01/05/2001},{01/07/2001},"-")
	var_Items.AddBar(h,"Task",{01/08/2001},{01/10/2001},"")
	var_Items.AddBar(h,"+",{01/11/2001},{01/13/2001},"+")
	var_Items.AddBar(h,"++",{01/14/2001},{01/16/2001},"++")
	' var_Items.ItemBar(h,"<*>",19) = 50
	oG2antt.TemplateDef = "dim var_Items,h"
	oG2antt.TemplateDef = var_Items
	oG2antt.TemplateDef = h
	oG2antt.Template = "var_Items.ItemBar(h,`<*>`,19) = 50"

	h = var_Items.AddItem("75%")
	var_Items.AddBar(h,"--",{01/02/2001},{01/04/2001},"--")
	var_Items.AddBar(h,"-",{01/05/2001},{01/07/2001},"-")
	var_Items.AddBar(h,"Task",{01/08/2001},{01/10/2001},"")
	var_Items.AddBar(h,"+",{01/11/2001},{01/13/2001},"+")
	var_Items.AddBar(h,"++",{01/14/2001},{01/16/2001},"++")
	' var_Items.ItemBar(h,"<*>",19) = 75
	oG2antt.TemplateDef = "dim var_Items,h"
	oG2antt.TemplateDef = var_Items
	oG2antt.TemplateDef = h
	oG2antt.Template = "var_Items.ItemBar(h,`<*>`,19) = 75"
|
|
1507
|
Is it possible to show the bars with a different brightness (1)
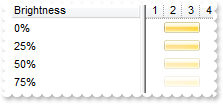
Dim h as N
Dim oG2antt as P
Dim var_Chart as P
Dim var_Items as P

oG2antt = topparent:CONTROL_ACTIVEX1.activex
oG2antt.VisualAppearance.Add(1,"c:\exontrol\images\normal.ebn")
var_Chart = oG2antt.Chart
	var_Chart.Bars.Item("Task").Color = 16777216
	var_Chart.FirstVisibleDate = {01/01/2001}
	' var_Chart.PaneWidth(.f.) = 128
	oG2antt.TemplateDef = "dim var_Chart"
	oG2antt.TemplateDef = var_Chart
	oG2antt.Template = "var_Chart.PaneWidth(False) = 128"

oG2antt.Columns.Add("Brightness")
var_Items = oG2antt.Items
	h = var_Items.AddItem("0%")
	var_Items.AddBar(h,"Task",{01/02/2001},{01/04/2001})
	h = var_Items.AddItem("25%")
	var_Items.AddBar(h,"Task",{01/02/2001},{01/04/2001})
	' var_Items.ItemBar(h,"",19) = 25
	oG2antt.TemplateDef = "dim var_Items,h"
	oG2antt.TemplateDef = var_Items
	oG2antt.TemplateDef = h
	oG2antt.Template = "var_Items.ItemBar(h,``,19) = 25"

	h = var_Items.AddItem("50%")
	var_Items.AddBar(h,"Task",{01/02/2001},{01/04/2001})
	' var_Items.ItemBar(h,"",19) = 50
	oG2antt.TemplateDef = "dim var_Items,h"
	oG2antt.TemplateDef = var_Items
	oG2antt.TemplateDef = h
	oG2antt.Template = "var_Items.ItemBar(h,``,19) = 50"

	h = var_Items.AddItem("75%")
	var_Items.AddBar(h,"Task",{01/02/2001},{01/04/2001})
	' var_Items.ItemBar(h,"",19) = 75
	oG2antt.TemplateDef = "dim var_Items,h"
	oG2antt.TemplateDef = var_Items
	oG2antt.TemplateDef = h
	oG2antt.Template = "var_Items.ItemBar(h,``,19) = 75"
|
|
1506
|
So the behavior I am looking for is that a change can cascade through a bar's successors, but a change that would affect a bar's predecessors is not allowed. Is this possible to in ExG2antt
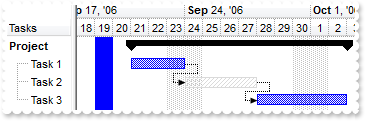
Dim h as N
Dim h1 as N
Dim h2 as N
Dim h3 as N
Dim oG2antt as P
Dim var_Chart as P
Dim var_Column as local
Dim var_Column1 as local
Dim var_Items as P

oG2antt = topparent:CONTROL_ACTIVEX1.activex
oG2antt.BeginUpdate()
oG2antt.MarkSearchColumn = .f.
oG2antt.OnResizeControl = 1
oG2antt.Columns.Add("Tasks")
' oG2antt.Columns.Add("Start").Visible = .f.
var_Column = oG2antt.Columns.Add("Start")
oG2antt.TemplateDef = "dim var_Column"
oG2antt.TemplateDef = var_Column
oG2antt.Template = "var_Column.Visible = False"

' oG2antt.Columns.Add("End").Visible = .f.
var_Column1 = oG2antt.Columns.Add("End")
oG2antt.TemplateDef = "dim var_Column1"
oG2antt.TemplateDef = var_Column1
oG2antt.Template = "var_Column1.Visible = False"

var_Chart = oG2antt.Chart
	var_Chart.LevelCount = 2
	var_Chart.FirstVisibleDate = {09/18/2006}
	' var_Chart.PaneWidth(.f.) = 64
	oG2antt.TemplateDef = "dim var_Chart"
	oG2antt.TemplateDef = var_Chart
	oG2antt.Template = "var_Chart.PaneWidth(0) = 64"

	' var_Chart.ScrollRange(0) = var_Chart.FirstVisibleDate
	oG2antt.TemplateDef = "dim var_Chart"
	oG2antt.TemplateDef = var_Chart
	oG2antt.Template = "var_Chart.ScrollRange(0) = FirstVisibleDate"

	' var_Chart.ScrollRange(1) = {12/31/2006}
	oG2antt.TemplateDef = "dim var_Chart"
	oG2antt.TemplateDef = var_Chart
	oG2antt.Template = "var_Chart.ScrollRange(1) = #12/31/2006#"

	var_Chart.MarkSelectDateColor = 2147418112
	var_Chart.SelectLevel = 1
	' var_Chart.SelectDate({09/19/2006}) = .t.
	oG2antt.TemplateDef = "dim var_Chart"
	oG2antt.TemplateDef = var_Chart
	oG2antt.Template = "var_Chart.SelectDate(#9/19/2006#) = True"

	var_Chart.AllowCreateBar = 0
	var_Chart.AllowLinkBars = .f.
var_Items = oG2antt.Items
	h = var_Items.AddItem("Project")
	' var_Items.CellValue(h,1) = {09/21/2006}
	oG2antt.TemplateDef = "dim var_Items,h"
	oG2antt.TemplateDef = var_Items
	oG2antt.TemplateDef = h
	oG2antt.Template = "var_Items.CellValue(h,1) = #9/21/2006#"

	' var_Items.CellValue(h,2) = {10/03/2006}
	oG2antt.TemplateDef = "dim var_Items,h"
	oG2antt.TemplateDef = var_Items
	oG2antt.TemplateDef = h
	oG2antt.Template = "var_Items.CellValue(h,2) = #10/3/2006#"

	var_Items.AddBar(h,"Summary",var_Items.CellValue(h,1),var_Items.CellValue(h,2),"sum")
	h1 = var_Items.InsertItem(h,,"Task 1")
	' var_Items.CellValue(h1,1) = var_Items.CellValue(h,1)
	oG2antt.TemplateDef = "dim var_Items,h1"
	oG2antt.TemplateDef = var_Items
	oG2antt.TemplateDef = h1
	oG2antt.Template = "var_Items.CellValue(h1,1) = CellValue(h,1)"

	' var_Items.CellValue(h1,2) = {09/24/2006}
	oG2antt.TemplateDef = "dim var_Items,h1"
	oG2antt.TemplateDef = var_Items
	oG2antt.TemplateDef = h1
	oG2antt.Template = "var_Items.CellValue(h1,2) = #9/24/2006#"

	var_Items.AddBar(h1,"Task",var_Items.CellValue(h1,1),var_Items.CellValue(h1,2),"K1")
	' var_Items.ItemBar(h1,"K1",22) = {09/20/2006}
	oG2antt.TemplateDef = "dim var_Items,h1"
	oG2antt.TemplateDef = var_Items
	oG2antt.TemplateDef = h1
	oG2antt.Template = "var_Items.ItemBar(h1,`K1`,22) = #9/20/2006#"

	h2 = var_Items.InsertItem(h,,"Task 2")
	' var_Items.CellValue(h2,1) = var_Items.CellValue(h1,2)
	oG2antt.TemplateDef = "dim var_Items,h2"
	oG2antt.TemplateDef = var_Items
	oG2antt.TemplateDef = h2
	oG2antt.Template = "var_Items.CellValue(h2,1) = CellValue(h1,2)"

	' var_Items.CellValue(h2,2) = {09/28/2006}
	oG2antt.TemplateDef = "dim var_Items,h2"
	oG2antt.TemplateDef = var_Items
	oG2antt.TemplateDef = h2
	oG2antt.Template = "var_Items.CellValue(h2,2) = #9/28/2006#"

	var_Items.AddBar(h2,"Unknown",var_Items.CellValue(h2,1),var_Items.CellValue(h2,2),"K2")
	var_Items.AddLink("L1",h1,"K1",h2,"K2")
	h3 = var_Items.InsertItem(h,,"Task 3")
	' var_Items.CellValue(h3,1) = var_Items.CellValue(h2,2)
	oG2antt.TemplateDef = "dim var_Items,h3"
	oG2antt.TemplateDef = var_Items
	oG2antt.TemplateDef = h3
	oG2antt.Template = "var_Items.CellValue(h3,1) = CellValue(h2,2)"

	' var_Items.CellValue(h3,2) = var_Items.CellValue(h,2)
	oG2antt.TemplateDef = "dim var_Items,h3"
	oG2antt.TemplateDef = var_Items
	oG2antt.TemplateDef = h3
	oG2antt.Template = "var_Items.CellValue(h3,2) = CellValue(h,2)"

	var_Items.AddBar(h3,"Task",var_Items.CellValue(h3,1),var_Items.CellValue(h3,2),"K3")
	var_Items.AddLink("L2",h2,"K2",h3,"K3")
	var_Items.GroupBars(h1,"K1",.f.,h2,"K2",.t.,31,"0;4")
	var_Items.GroupBars(h2,"K2",.f.,h3,"K3",.t.,31,"0;2")
	var_Items.DefineSummaryBars(h,"sum",h1,"K1")
	var_Items.DefineSummaryBars(h,"sum",h2,"K2")
	var_Items.DefineSummaryBars(h,"sum",h3,"K3")
	' var_Items.ExpandItem(h) = .t.
	oG2antt.TemplateDef = "dim var_Items,h"
	oG2antt.TemplateDef = var_Items
	oG2antt.TemplateDef = h
	oG2antt.Template = "var_Items.ExpandItem(h) = True"

	' var_Items.ItemBold(h) = .t.
	oG2antt.TemplateDef = "dim var_Items,h"
	oG2antt.TemplateDef = var_Items
	oG2antt.TemplateDef = h
	oG2antt.Template = "var_Items.ItemBold(h) = True"

oG2antt.EndUpdate()
|
|
1505
|
How can I have a case-insensitive filter (exFilterDoCaseSensitive flag is not set)
Dim oG2antt as P
Dim var_Chart as local
Dim var_Column as P
Dim var_Column1 as P
Dim var_Columns as P
Dim var_Items as P

oG2antt = topparent:CONTROL_ACTIVEX1.activex
oG2antt.BeginUpdate()
' oG2antt.Chart.PaneWidth(.t.) = 0
var_Chart = oG2antt.Chart
oG2antt.TemplateDef = "dim var_Chart"
oG2antt.TemplateDef = var_Chart
oG2antt.Template = "var_Chart.PaneWidth(True) = 0"

oG2antt.MarkSearchColumn = .f.
var_Columns = oG2antt.Columns
	var_Column = var_Columns.Add("Car")
		var_Column.DisplayFilterButton = .t.
		var_Column.FilterType = 240
		var_Column.Filter = "MAZDA"
	var_Column1 = var_Columns.Add("Equipment")
		var_Column1.DisplayFilterButton = .t.
		var_Column1.DisplayFilterPattern = .f.
		var_Column1.CustomFilter = "Air Bag||*Air Bag*|||Air condition||*Air condition*|||ABS||*ABS*|||ESP||*ESP*"
		var_Column1.FilterType = 3
		var_Column1.Filter = "AIR BAG"
var_Items = oG2antt.Items
	' var_Items.CellValue(var_Items.AddItem("Mazda"),1) = "Air Bag"
	oG2antt.TemplateDef = "dim var_Items"
	oG2antt.TemplateDef = var_Items
	oG2antt.Template = "var_Items.CellValue(AddItem(`Mazda`),1) = `Air Bag`"

	' var_Items.CellValue(var_Items.AddItem("Toyota"),1) = "Air Bag,Air condition"
	oG2antt.TemplateDef = "dim var_Items"
	oG2antt.TemplateDef = var_Items
	oG2antt.Template = "var_Items.CellValue(AddItem(`Toyota`),1) = `Air Bag,Air condition`"

	' var_Items.CellValue(var_Items.AddItem("Ford"),1) = "Air condition"
	oG2antt.TemplateDef = "dim var_Items"
	oG2antt.TemplateDef = var_Items
	oG2antt.Template = "var_Items.CellValue(AddItem(`Ford`),1) = `Air condition`"

	' var_Items.CellValue(var_Items.AddItem("Nissan"),1) = "Air Bag,ABS,ESP"
	oG2antt.TemplateDef = "dim var_Items"
	oG2antt.TemplateDef = var_Items
	oG2antt.Template = "var_Items.CellValue(AddItem(`Nissan`),1) = `Air Bag,ABS,ESP`"

	' var_Items.CellValue(var_Items.AddItem("Mazda"),1) = "Air Bag, ABS,ESP"
	oG2antt.TemplateDef = "dim var_Items"
	oG2antt.TemplateDef = var_Items
	oG2antt.Template = "var_Items.CellValue(AddItem(`Mazda`),1) = `Air Bag, ABS,ESP`"

	' var_Items.CellValue(var_Items.AddItem("Mazda"),1) = "ABS,ESP"
	oG2antt.TemplateDef = "dim var_Items"
	oG2antt.TemplateDef = var_Items
	oG2antt.Template = "var_Items.CellValue(AddItem(`Mazda`),1) = `ABS,ESP`"

oG2antt.ApplyFilter()
oG2antt.EndUpdate()
|
|
1504
|
How can I have a case-sensitive filter
Dim oG2antt as P
Dim var_Chart as local
Dim var_Column as P
Dim var_Column1 as P
Dim var_Columns as P
Dim var_Items as P

oG2antt = topparent:CONTROL_ACTIVEX1.activex
oG2antt.BeginUpdate()
' oG2antt.Chart.PaneWidth(.t.) = 0
var_Chart = oG2antt.Chart
oG2antt.TemplateDef = "dim var_Chart"
oG2antt.TemplateDef = var_Chart
oG2antt.Template = "var_Chart.PaneWidth(True) = 0"

oG2antt.MarkSearchColumn = .f.
var_Columns = oG2antt.Columns
	var_Column = var_Columns.Add("Car")
		var_Column.DisplayFilterButton = .t.
		var_Column.FilterType = 496 'exFilterDoCaseSensitive + exFilter
		var_Column.Filter = "Mazda"
	var_Column1 = var_Columns.Add("Equipment")
		var_Column1.DisplayFilterButton = .t.
		var_Column1.DisplayFilterPattern = .f.
		var_Column1.CustomFilter = "Air Bag||*Air Bag*|||Air condition||*Air condition*|||ABS||*ABS*|||ESP||*ESP*"
		var_Column1.FilterType = 259 'exFilterDoCaseSensitive + exPattern
		var_Column1.Filter = "Air Bag"
var_Items = oG2antt.Items
	' var_Items.CellValue(var_Items.AddItem("Mazda"),1) = "Air Bag"
	oG2antt.TemplateDef = "dim var_Items"
	oG2antt.TemplateDef = var_Items
	oG2antt.Template = "var_Items.CellValue(AddItem(`Mazda`),1) = `Air Bag`"

	' var_Items.CellValue(var_Items.AddItem("Toyota"),1) = "Air Bag,Air condition"
	oG2antt.TemplateDef = "dim var_Items"
	oG2antt.TemplateDef = var_Items
	oG2antt.Template = "var_Items.CellValue(AddItem(`Toyota`),1) = `Air Bag,Air condition`"

	' var_Items.CellValue(var_Items.AddItem("Ford"),1) = "Air condition"
	oG2antt.TemplateDef = "dim var_Items"
	oG2antt.TemplateDef = var_Items
	oG2antt.Template = "var_Items.CellValue(AddItem(`Ford`),1) = `Air condition`"

	' var_Items.CellValue(var_Items.AddItem("Nissan"),1) = "Air Bag,ABS,ESP"
	oG2antt.TemplateDef = "dim var_Items"
	oG2antt.TemplateDef = var_Items
	oG2antt.Template = "var_Items.CellValue(AddItem(`Nissan`),1) = `Air Bag,ABS,ESP`"

	' var_Items.CellValue(var_Items.AddItem("Mazda"),1) = "Air Bag, ABS,ESP"
	oG2antt.TemplateDef = "dim var_Items"
	oG2antt.TemplateDef = var_Items
	oG2antt.Template = "var_Items.CellValue(AddItem(`Mazda`),1) = `Air Bag, ABS,ESP`"

	' var_Items.CellValue(var_Items.AddItem("Mazda"),1) = "ABS,ESP"
	oG2antt.TemplateDef = "dim var_Items"
	oG2antt.TemplateDef = var_Items
	oG2antt.Template = "var_Items.CellValue(AddItem(`Mazda`),1) = `ABS,ESP`"

oG2antt.ApplyFilter()
oG2antt.EndUpdate()
|
|
1503
|
Is it possible to add a custom label to the days with a specified background color
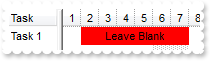
Dim h1 as N
Dim oG2antt as P
Dim var_Chart as P
Dim var_Items as P

oG2antt = topparent:CONTROL_ACTIVEX1.activex
oG2antt.BeginUpdate()
oG2antt.Columns.Add("Task")
var_Chart = oG2antt.Chart
	var_Chart.FirstVisibleDate = {01/01/2001}
	' var_Chart.PaneWidth(.f.) = 48
	oG2antt.TemplateDef = "dim var_Chart"
	oG2antt.TemplateDef = var_Chart
	oG2antt.Template = "var_Chart.PaneWidth(False) = 48"

var_Items = oG2antt.Items
	h1 = var_Items.AddItem("Task 1")
	var_Items.AddBar(h1,"",{01/02/2001},{01/08/2001},"K1","Leave Blank")
	' var_Items.ItemBar(h1,"K1",29) = .f.
	oG2antt.TemplateDef = "dim var_Items,h1"
	oG2antt.TemplateDef = var_Items
	oG2antt.TemplateDef = h1
	oG2antt.Template = "var_Items.ItemBar(h1,`K1`,29) = False"

	' var_Items.ItemBar(h1,"K1",7) = 255
	oG2antt.TemplateDef = "dim var_Items,h1"
	oG2antt.TemplateDef = var_Items
	oG2antt.TemplateDef = h1
	oG2antt.Template = "var_Items.ItemBar(h1,`K1`,7) = 255"

oG2antt.EndUpdate()
|
|
1502
|
What is the event fired when I change "...Chart.PaneWidthLeft" (or "...Chart.PaneWidthRight") in the Gantt splitter window
' Occurs after the chart has been changed.
function ChartEndChanging as v (Operation  as  OLE::Exontrol.G2antt.1::BarOperationEnum)
	oG2antt = topparent:CONTROL_ACTIVEX1.activex
	? "End Operation(exVSplitterChange(10)"
	? Operation
	? "PaneWidth:"
	? .PaneWidth(oG2antt.Chart.f.)
end function

' Occurs when the chart is about to be changed.
function ChartStartChanging as v (Operation  as  OLE::Exontrol.G2antt.1::BarOperationEnum)
	oG2antt = topparent:CONTROL_ACTIVEX1.activex
	? "Start Operation(exVSplitterChange(10)"
	? Operation
	? "PaneWidth:"
	? .PaneWidth(oG2antt.Chart.f.)
end function

Dim oG2antt as P

oG2antt = topparent:CONTROL_ACTIVEX1.activex
|
|
1501
|
I want to ask if I can select more than one bar in the chart and move them together
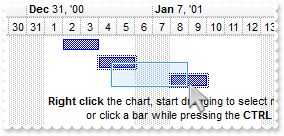
Dim h as N
Dim oG2antt as P
Dim var_Chart as P
Dim var_Items as P

oG2antt = topparent:CONTROL_ACTIVEX1.activex
oG2antt.BeginUpdate()
oG2antt.Columns.Add("Task")
var_Chart = oG2antt.Chart
	var_Chart.FirstVisibleDate = {12/29/2000}
	' var_Chart.PaneWidth(.f.) = 64
	oG2antt.TemplateDef = "dim var_Chart"
	oG2antt.TemplateDef = var_Chart
	oG2antt.Template = "var_Chart.PaneWidth(False) = 64"

	var_Chart.LevelCount = 2
var_Items = oG2antt.Items
	var_Items.AddBar(var_Items.AddItem("Task 1"),"Task",{01/02/2001},{01/04/2001},"K1")
	var_Items.AddBar(var_Items.AddItem("Task 2"),"Task",{01/04/2001},{01/06/2001},"K2")
	var_Items.AddBar(var_Items.AddItem("Task 3"),"Task",{01/08/2001},{01/10/2001},"K3")
	h = var_Items.AddItem("")
	var_Items.AddBar(h,"",{01/08/2001},{01/10/2001},"","<b>Right click</b> the chart, start dragging to select multiple bars<br>or click a bar while pressing the <b>CTRL</b> key")
	' var_Items.ItemHeight(h) = 36
	oG2antt.TemplateDef = "dim var_Items,h"
	oG2antt.TemplateDef = var_Items
	oG2antt.TemplateDef = h
	oG2antt.Template = "var_Items.ItemHeight(h) = 36"

	' var_Items.ItemBar(h,"",29) = .f.
	oG2antt.TemplateDef = "dim var_Items,h"
	oG2antt.TemplateDef = var_Items
	oG2antt.TemplateDef = h
	oG2antt.Template = "var_Items.ItemBar(h,``,29) = False"

oG2antt.EndUpdate()
|